The Leatherback Long/Short Alternative Yield ETF (LBAY) (the “Fund”) net asset value (NAV) advanced by 0.58% in January, compared to 6.28% for the S&P 500 Index. LBAY paid our twenty-sixth consecutive monthly distribution, at $0.075 per share in January. This is a 2.26% SEC yield versus the S&P 500 Index dividend yield of approximately 1.66%, and the 10-Year US Treasury yield of 3.511%. Year to date as of January 31, 2023, NAV for the Fund has returned 0.58%, compared to 6.28% for the S&P 500 Index. NAV performance for the Fund to date since inception (November 16, 2020) has produced a 57.24% cumulative total return and a 22.75% annualized total return.
The performance data quoted represents past performance. Past performance does not guarantee future results. The investment return and principal value of an investment will fluctuate so that an investor’s shares, when sold or redeemed, may be worth more or less than their original cost and current performance may be lower or higher than the performance quoted. Performance current to the most recent month-end can be obtained by calling (833) 417-0090. The gross expense ratio for the fund is 1.32%.
View LBAY standardized performance here.
The Fund’s NAV is the sum of all its assets less any liabilities, divided by the number of shares outstanding. The market price is the most recent price at which the Fund was traded.
THE RETURN OF THE MEME
To kick off the year, we find ourselves asking if twenty-three rhymes with twenty-one. The first few months may feel similar, but we doubt the next few quarters will reflect the rally experienced throughout 2021.
We do not think the story has changed; we believe we are re-reading the middle chapters of the same book. The US Federal Reserve Board (the Fed) continues to guide markets that interest rates need to continue their path higher while preparing for the possibility that they will remain elevated for a longer period of time. We see what we suppose are the same type of market dynamics that existed through the “meme-stock craze” in 2021. Many companies that we find fundamentally weak have enjoyed surging share prices to start the year. Have the growth prospects of these companies materially improved? Has some overlooked value been suddenly unlocked in these names? Or, perhaps, is it simply market participants chasing the optimism that the Fed will shift policy back to the glory days of “free” money?
We look back to our August 2022 insight, and wonder again if we are in the midst of another rally on the way down to lower levels. The management teams that maintained enthusiasm about improving status quo during the last earnings cycle seem to be less confident during the release of the most recent number prints. Borrowing costs are in fact higher, and inflation is unfortunately still a word rattling through the minds of most consumers. We are hearing the term “trading down” used quite a bit when referencing consumer spend. The calculus for the growth that we see currently being priced into many stock prices does not equate, in our opinion, to the amount of dollars available in the pockets of many Americans.
“While the consumer may not have cut back on total dollar amounts spent, we think they are buying less quantities of the goods and services that have allowed many companies to report results that were not ‘as bad as feared’.” – Leatherback Asset Management, August 2022
THE TWO E'S
Earnings and Employment. We think these are the key drivers that will determine the path the market will take next. For us, the signal in the noise this time around is an echoing mantra; revenue beats, earnings and margins miss. We continue to wonder how long it will go unnoticed that the bar on profitability and performance metric outlooks continues to be lowered.
On the one hand, earnings and margins appear to be contracting. The cost of profitability is wrenching higher. On the other, the Fed is telling the public job losses are “needed”, and to be prepared to expect them. In other words, broader prices cannot revert to longer-term inflation targets if workers continue to expect and command higher wages (enter the debate on wage-price spiral). Given these undercurrents, we think share price multiples may resume a trend down.
“Despite the slowdown in growth, the labor market remains extremely tight, with the unemployment rate at a 50-year low, job vacancies still very high, and wage growth elevated…, the labor market continues to be out of balance.” – Fed Chair Jerome Powell, February 1, 2023
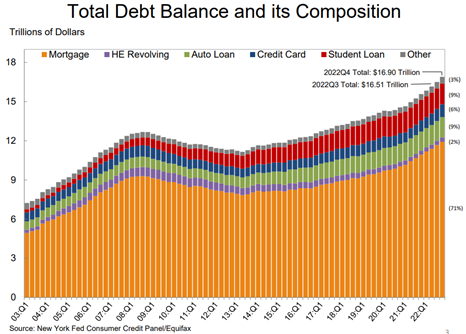
Notably, household debt has been marching higher. In the last few months, household debt hit a record $16.9 trillion, led by mortgage debt which hit a record $11.9 trillion. Additionally, auto loans continue the march to higher all-time highs and student loan debt hit an all-time high of $1.6 trillion. Credit card debt also hit another new all-time high of $986 billion3. Employment needs to remain ebullient to enable consumers to service these all-time high debt loads.
PORTFOLIO UPDATE4*
We recently initiated a position in Waste Management, Inc. (WM), the largest waste collector in the US with just under $20B in revenues and a market capitalization of approximately $60B. We are intrigued by the waste collection business as we think it provides recession-resilient recurring revenues with strong and consistent free cash flow. WM has a long history of shareholder-friendly capital allocation as the company has increased its dividend annually for nineteen consecutive years. WM has bought back roughly $2B in share repurchases as well. The stock has fallen over the last several months and now trades at the low end of its longer-term price to earnings multiple range. Given our view that recession risk is elevated in 2023 or 2024, we find WM a compelling long position in today’s environment.
On the short side of the book, we have had several higher beta, low quality positions rally significantly to begin 2023. We maintain short exposure across most of these names but have risk-managed the positions by reigning them within a target of approximately 2% level exposure limits. We believe the market set up is very rewarding for the remainder of 2023 as many low quality, high valuation names have re-rated higher providing a nice set-up on the short side.
View LBAY top 10 holdings here. Holdings are subject to change. Characteristics and metrics of the companies shown are for the underlying securities in the fund’s portfolio and do not represent or predict the performance of the fund. There is no guarantee that a company will pay or continually increase its dividend.
FINAL THOUGHTS
We hope our investor partners enjoy our monthly perspectives. We are finding many compelling ideas both long and short and we look forward to continuing our dialogue in the weeks and months ahead.
