The Leatherback Long/Short Alternative Yield ETF (LBAY) (the “Fund”) NAV advanced by 10.18% in December, compared to an advance of 4.48% for the S&P 500 Index. LBAY paid our thirteenth consecutive monthly distribution, at $0.065 per share in December. This is a 3.20% SEC yield versus the S&P 500 Index dividend yield of approximately 1.27%, and the 10-Year US Treasury yield of approximately 1.51%. Year to date as of December 31, 2021, NAV for the Fund has returned 22.39%, compared to 28.71% for the S&P 500 Index. NAV performance for the Fund to date since inception (November 16, 2020) has produced a 27.73% cumulative total return and a 24.34% annualized total return.
The performance data quoted represents past performance. Past performance does not guarantee future results. The investment return and principal value of an investment will fluctuate so that an investor’s shares, when sold or redeemed, may be worth more or less than their original cost and current performance may be lower or higher than the performance quoted. Performance current to the most recent month-end can be obtained by calling (833) 417-0090. The gross expense ratio for the fund is 1.43%.
View LBAY standardized performance here.
The Fund’s NAV is the sum of all its assets less any liabilities, divided by the number of shares outstanding. The market price is the most recent price at which the Fund was traded.
We believe 2022 will be ripe for stock picking. We think fundamentals matter, and the opportunities that are available may lead to 2022 being an alpha-generating year for short selling. After a decade plus of Central Bank accommodation and a year and a half of unprecedented stimulus, the Federal Reserve is finding its inflationary hand is being forced - Global Central Banks will be reducing stimulus. The rotation out of growth factors and into value stocks has been taking place for the last several months. We think this may only be the beginning. Last year, the consensus was very hesitant to pound the table on inflation, simply because every call for it over the last decade had been wrong. We think there is a rhyme here and suspect the market may reluctantly bring value stocks back into favor.
“We think it’s firing on all cylinders now…The fundamentals are right, the price momentum is right and the valuation spreads are still, ignoring the prior six months, at records3.” - Cliff Asness
A year ago, the meme stock craze was at its height, and many allocators swore off short-selling and many of those that ran short “books” may have sought refuge within index hugging ETFs. As we wrote at that time, we thought that would prove to be a mistake.
“One could argue we need short sellers now perhaps more than ever.” - Leatherback Asset Management, February 23, 2021
There appears to be more and more evidence pointing to the highly accommodative fiscal and monetary policies as being the major contributor that facilitated an ebullient market environment for risk taking. Is this unprecedented government spending the driver of what is being called economic growth?
“If you go back four decades of stock market data, there are many valuation metrics that are in the top 1 percentile of overvaluation. So, the thing that’s keeping it going, of course, is the Fed with rates at zero and promises to stay at zero,…[this] allows for valuations to be record-breakingly high.4” - Jeffrey Gundlach
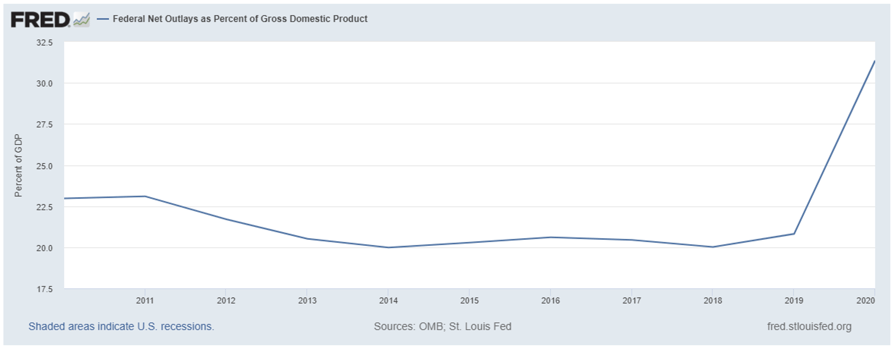
The visual representation below showing the latest data of the non-seasonally adjusted contribution of these government outlays through January 1st of 2020 is rather striking5. With the possibility of an environment that may continue to see a further rise in interest rates, along with anticipation of imminent tapering, we may soon get an answer to the above question on growth drivers. Given this, we expect choppier markets during 2022 and think we will see volatility across sectors, both of which may provide security specific dislocations.
THE MINUTES
The tape looks like it is responding to what the Federal Open Market Committee is saying it will do next. The minutes of the December meeting were released in the first week of January, and it appears market watchers are viewing details in the minutes as a bit more hawkish than the message delivered to reporters after the meeting in mid-December. Later in the week, jobs numbers were released, with the overall top line number missing estimates for the increase in month over month jobs. Interestingly, the labor force participation rate was all but unchanged, the unemployment rate fell below 4% (a number that hasn’t been breached since the economic shut-down in early 2020), and hourly earnings were hotter than expected. We pointed to some questions during the second and third quarters of 2021, which appear to continue to perplex policymakers, that we may now be seeing the answers to. Are there less workers, with more of those workers already employed, and requiring higher levels of pay to do the job?
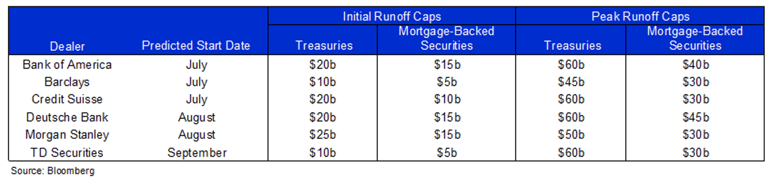
We pointed to the challenge and timing of balance sheet reduction in our last installment, and it appears that the market was surprised to see the minutes reflective of internal Fed discussions about a possible decrease. Below is a summary of dealer views on the possible path for the runoff 6:
What does this mean? Maybe there was a disbelief that the Fed needed to, would or could take any of the three actions of tapering, hiking, or running off the balance sheet with “quantitative tightening”. Short and intermediate US Treasury yields have adjusted higher in response as we write this piece, with yields out through the 10-year touching the highest levels since pre-pandemic. It remains to be seen if the rates complex takes another leg higher, and how markets respond, but maybe the perceived “Fed Put” is through the recent lows.
What does this mean for asset markets? No matter what the answer is, we think there are opportunities to explore, and we look forward to continuing our dialogue in the weeks and months ahead.
PORTFOLIO UPDATE7
We are finding many compelling ideas both long and short in the current market landscape. First, we have been adding long exposure to Zimmer Biomet Holdings Inc (ZBH), a leading medical equipment manufacturer that generates significant revenues from knee and hip replacement products. In our opinion, sentiment will shift positively as the cadence of the year 2022 plays out and investors begin to look past the tepid, yet temporary, fundamental business headwinds as elective surgical procedures have decreased dramatically due to persistent COVID-19-related issues. We do not think the longer-term secular demand for replacement hips and knees is declining and expect a return coming out of the pandemic as elective surgeries normalize. Additionally, ZBH announced intent early last year to spin off its spine and dental businesses as ZimVie. We have made ZBH a top ten position in our portfolio, and we believe there may be substantial upside potential from its December 52-week low stock price.
Next, we look to Carvana Co (CVNA), which we first discussed in our August insight. CVNA remains a core short for the Fund, and we believe the stock may continue its downtrend that began in the third quarter of last year. Carvana markets itself as an e-commerce disruptor and online platform for used cars. Yet, we believe the company’s business is fully reliant on the asset-backed securities market as they package subprime used car loans and sell them into the securitization market. Much of their reported gross profit per unit (per car) is generated from the gain on sale of loans packaged into securities. We think both the underwriting of the loans to subprime borrowers as well as the collateral itself may prove fleeting as the tranches of securities season. If the securitization market seizes, or even becomes less thrilled about the used car loan collateral, we believe CVNA could see more downside pressure on its stock price.
Lastly, we think consumer discretionary stocks broadly may have a challenging set up as stimulus has been removed and inflationary pressures persist, leaving less pocket money for many optional purchases. We recently added a new short position in Lululemon Athletica Inc (LULU), where we think the valuation may be more stretched than the pants.
FINAL THOUGHTS
Leatherback is thankful for those that have entrusted us. Our goal has been to provide institutional quality long/short investing alternatives to the masses in a fully transparent, and potentially tax efficient ETF**. As we enter the new year, we hope you consider us for an allocation in 2022 and beyond.
