The Leatherback Long/Short Alternative Yield ETF (LBAY) (the “Fund”) NAV declined by 5.32% in June, compared to an advance of 2.33% for the S&P 500 Index. LBAY paid our seventh consecutive monthly distribution of $0.06 per share. This is a 3.61% SEC yield versus the S&P 500 Index dividend yield of approximately 1.35%, and the 10-Year US Treasury yield of approximately 1.47%. Year to date as of June 30, 2021, NAV for the fund has returned 13.51%, compared to 15.25% for the S&P 500 Index. Cumulative since inception (November 16, 2020) performance to date, NAV for the Fund has produced a 18.47% total return.
The performance data quoted represents past performance. Past performance does not guarantee future results. The investment return and principal value of an investment will fluctuate so that an investor’s shares, when sold or redeemed, may be worth more or less than their original cost and current performance may be lower or higher than the performance quoted. Performance current to the most recent month-end can be obtained by calling (833) 417-0090. The gross expense ratio for the fund is 1.09%.
View LBAY standardized performance here.
The Fund’s NAV is the sum of all its assets less any liabilities, divided by the number of shares outstanding. The market price is the most recent price at which the Fund was traded.
Well, that was something! If you look at the markets on the first and last days of June, you may have concluded that it was an uneventful month: Treasury rates moved slightly, oil rallied, growth stocks performed….and that’s all folks. The Dow was approximately flat, the S&P 500 Index advanced by 2.33%, but the NASDAQ roared approximately 5.55%.
We think there is more to talk about. In our opinion, the dispersion in market sectors and factors was important and cannot be overlooked. Notably, the FOMC announced its rate decision and held a press conference on June 16th.
"I think this Fed meeting could be the most important meeting of Jay Powell's career and certainly the most important Fed meeting of the past four or five years. And the reason why is because we have had so much incoming data that challenges both their mission and their model." - Paul Tudor Jones3
While the Fed announced no change in policy, the market certainly reacted in the aftermath. Technology rallied, Financials declined, Materials declined more, equity volatility fell, and rates volatility increased. The S&P Pure Growth index rose 7.69%, while Pure Value fell 3.8%. Long duration stocks led the market while value and dividend-focused sectors and factors lagged significantly. Meanwhile, energy stocks bucked the cyclical underperformance due to the rally in oil prices. A visual of sector performance can be seen in the below table4:
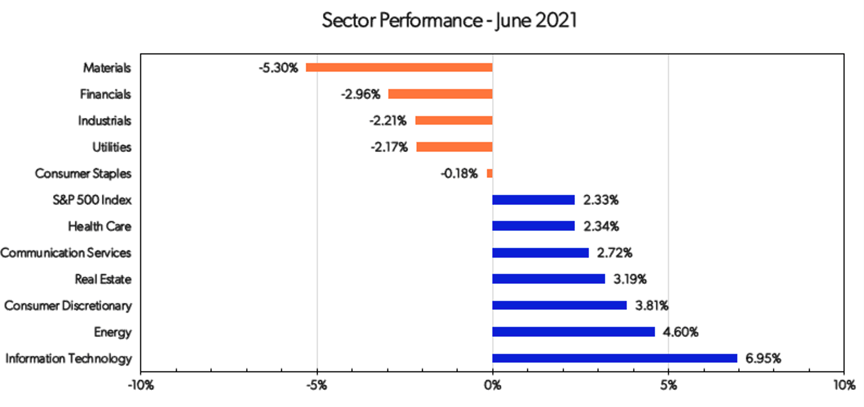
This all happened just after Financials became the new momentum stocks, and Technology was significantly reduced in the momentum category, with one momentum fund increasing exposure weightings of financials from minimal to a third, increasing industrials, reducing consumer discretionary, and cutting technology by half 5.
As we outlined in some of our expectations in our May commentary, the Fed capitulated (debate rages by how much) and acknowledged they are not just thinking about thinking about tapering, and actually addressed the term specifically saying it should be retired:
“You can think of this meeting that we had as the ‘talking about talking about’ meeting, if you’d like…I now suggest that we retire that term, which has served its purpose.” - Jerome Powell8
The directive was given for market participants to understand the taper discussion is now taking place within the Fed walls.
The definitions of the terms “hot” and “transitory” as conveyed by the Fed has started to become a bit looser as well. There was a pivot to acknowledging that inflation is running higher than was expected, and that the tenor of the potential paradigm shift in price prints may be a little longer than initially telegraphed. It appears the Fed was a bit surprised by the economic numbers that are coming through, with even the Treasury discussing higher levels of inflation out to year-end or longer.
The result: short term Treasury rates rose slightly, and mid-to-long maturity Treasury rates fell, causing a significant compression and flattening of the rates differential. In our opinion, this has caused a sentiment shift back toward long duration winners versus the broader market.
THE QUESTION
With the Fed walking back their language, is the market pricing deflation here by staying on the other side of the argument?
We think there are opportunities to explore no matter what the answer is, and we look forward to continuing our dialogue in the weeks and months ahead.
