The Leatherback Long/Short Alternative Yield ETF (LBAY) (the “Fund”) net asset value (NAV) increased by 1.65% in December, compared to an increase of 4.54% for the S&P 500 Index. LBAY paid our thirty-seventh consecutive monthly distribution, at $0.076 per share in December. This is a 2.66% SEC yield versus the S&P 500 Index dividend yield of approximately 1.49%, and the 10-Year US Treasury yield of 3.88%. Year to date as of December 31, 2023, NAV for the Fund declined 8.46%, compared to an increase of 26.29% for the S&P 500 Index. NAV performance for the Fund to date since inception (November 16, 2020) has produced a 43.10% cumulative total return and a 12.16% annualized total return.

The performance data quoted represents past performance. Past performance does not guarantee future results. The investment return and principal value of an investment will fluctuate so that an investor’s shares, when sold or redeemed, may be worth more or less than their original cost and current performance may be lower or higher than the performance quoted. Performance current to the most recent month-end can be obtained by calling (833) 417-0090. The gross expense ratio for the fund is 1.24%.
View LBAY standardized performance here.
The Fund’s NAV is the sum of all its assets less any liabilities, divided by the number of shares outstanding. The market price is the most recent price at which the Fund was traded.
CIRCULAR MOTION
After a blistering 26% total return on the S&P 500 Index1 in 2023, investors appear ready for lower rates and a resumption to the growth fueled thirteen-year rally that began in 2009 and ended in 2021. Yet, viewed through a different lens, we would argue the S&P 500 went almost nowhere over the last two calendar years totaling a 3.4% return. This is despite the large moves of down 18.3% in 2022 and up 26.3% in 2023. Similarly, while we have witnessed unfamiliar volatility in the bond market, over the last calendar year the 10-year US treasury was virtually unchanged. To end 2023, the yield of 3.880% moved less than 1 basis point* compared to 3.877% at the end of 20223. Over that short period of time, the consensus herd seemingly found plenty of themes to crowd. Despite the year 2023 experiencing the biggest year in bank failures in history, with banks totaling $548.7B in combined assets failing4, large cap growth stocks rallied sharply. The predominant investor narrative centered on the performance of the Magnificent Seven as each of the seven returned no less than 49%3; at the time of this writing, six currently maintain market caps of over $1 Trillion! Next, investors disrupted the healthcare and consumer staples sectors. Medical device and junk food-related stocks were sent lower while GLP-1 drug manufacturers rose higher as investors dreamt of a solution for weight loss. Finally, the prospective impact artificial intelligence may have on society created large dislocations across sectors and fueled the NASDAQ-100 Index5 up 55% on the year3!
For most economists, and those lacking artificial intelligence exposure in their portfolios, last year was humbling and confusing. The consensus entering 2023 was predicting a recession. Quite the opposite happened, and a year that commenced with pessimism and caution proved to be rewarding for most investors. The year 2023 became the year of hopeful rate cuts with the “Powell Pivot” in October igniting a ripping stock and bond rally into year end. While the headline equity market returns for 2023 were impressive, prudence and caution seem to be the posture taken by many, and it strikes us that there does not appear to be agreement on what 2024 may bring. The recent Barron’s roundtable presents the picture as follows:
“With a few exceptions, the members of the 2024 Barron’s Roundtable expect the stock market to disappoint, with the index delivering returns of minus-5% to plus-5% for the full year. No, they don’t see a ruinous recession, and yes, they expect the Federal Reserve to lower interest rates at some point during the year. Their main worry is that stocks are too richly valued, leaving little margin for error.”6
In our opinion, 2024 will be eventful with a Presidential election, potential rate cuts, and much more. Perhaps the equity market may go higher, what do you think?
MULTIPLE DIRECTIONS
“I don’t think today’s a fat pitch. The market is not crazy high and it’s not crazy low. It seems a little high, not enough to make you take action.”7 - Howard Marks
The FT Wilshire 5000 Index, a proxy for total market capitalization, rose by 26% with most of the total return contribution generated from price to earnings multiple expansion8, as earnings growth was benign. According to FactSet, Q4 2023 S&P 500 earnings are expected to decline by -0.1%, which will mark the fourth time in the past five quarters that the index has reported a year-over-year decline in earnings. Also, according to FactSet the forward 12-month P/E ratio* for the S&P 500 is 19.5x.9
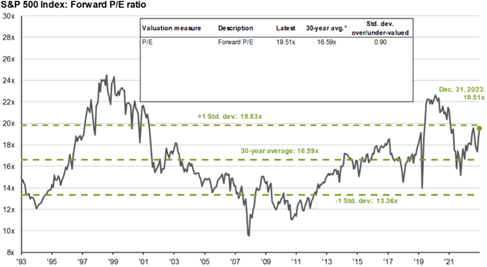
As shown in JP Morgan’s annual chartbook above, a 19.5x P/E is on the high end of history across the last three decades10. Interestingly, the consensus for the upcoming calendar year looks to be indicating multiple interest rate cuts and a soft landing. If the consensus is as good as it was in 2023, it could be highly unlikely to happen.
“…What we’re seeing now I think we can describe as a soft landing, and my hope is that it will continue.” – Janet Yellen
While we are uncertain about 2024’s ultimate path, we do believe the market is digesting the normalization of interest rates, which we think should cause dislocations and opportunities to deploy capital. The year 2022 came as a welcome relief to disciplined fundamental investors as rational market behavior returned. Inflation rose, interest rates spiked, and long duration* assets reset lower as the value of future cash flows declined. The year 2023 rallied on what we believe to be the imaginations of investors returning to a low interest rate environment. Beware of the head fake, and we caution anyone that is tempted to chase non-profitable, long-duration growth stocks.
In our opinion, investors should be cautious that rate cuts lengthen any rally without an improvement in corporate earnings. We think continued multiple expansion, absent earnings improvement, is unlikely. Presently, forecasts are for very little earnings growth in 2024.
“Weather forecast for tonight: dark” - George Carlin
On a positive note, this year and beyond could be opportune for fundamental investing styles, and the craft of good old fashioned financial statement analysis may prove paramount. Patient investors may well be rewarded, and we favor quality cash flow generating companies that will compound and create value over the long-term.
PORTFOLIO REVIEW11*
We are obviously disappointed with our performance in 2023 as the Fund NAV declined by 8.46% for the year. Notably, the short book, which included winner SVB Financial, generated losses overall with several names detracting from performance. On the long side, performance was overall positive, but given our objective of seeking long candidates with attractive shareholder yield, the Fund underperformed the S&P 500 and tech-heavy NASDAQ Composite Index12. Despite this drawdown, NAV performance for the fund since inception (November 16, 2020) through December 31, 2023 has produced a 43.10% cumulative total return and a 12.16% annualized total return, which has outperformed the S&P 500 Index with less risk as measured by the beta and correlations of the Fund.
As we enter 2024, we believe there are many long and short candidates. In our opinion, over the longer-term, fundamentals matter, and the opportunities that are available may lead to 2024 being an alpha-generating year for value investing and short selling. We believe the forces of deglobalization and onshoring of supply chains are costly, and while inflation has likely topped, we view the outlook over the next decade as very different from the past decade. We do not think zero rates will return and believe value-oriented equities that generate returns above a cost of capital that is non-zero will be rewarded. As was seen during 2022, non-profitable growth and meme stocks may prove fruitless.
View LBAY top 10 holdings here. Holdings are subject to change. Characteristics and metrics of the companies shown are for the underlying securities in the fund’s portfolio and do not represent or predict the performance of the fund. There is no guarantee that a company will pay or continually increase its dividend.
FINAL THOUGHTS
Leatherback is thankful for those that have entrusted us. Our goal has been to provide institutional quality long/short investing alternatives to the masses in a fully transparent, and potentially tax efficient Exchange Traded Fund (ETF)13. As we enter our fourth year, we hope you consider us for an allocation in 2024 and beyond.
