The Leatherback Long/Short Alternative Yield ETF (LBAY) (the “Fund”) net asset value (NAV) advanced by 1.82% in February, compared to a decline of 2.99% for the S&P 500 Index. LBAY paid its fifteenth consecutive monthly distribution, at $0.065 per share in February. This is a 3.28% SEC yield versus the S&P 500 Index dividend yield of approximately 1.40%, and the 10-Year US Treasury yield of 1.827%. Year to date as of February 28, 2022, NAV for the Fund has returned 7.08%, compared to a decline of 8.01% for the S&P 500 Index. NAV performance for the Fund to date since inception (November 16, 2020) has produced a 36.78% cumulative total return and a 27.60% annualized total return.
The performance data quoted represents past performance. Past performance does not guarantee future results. The investment return and principal value of an investment will fluctuate so that an investor’s shares, when sold or redeemed, may be worth more or less than their original cost and current performance may be lower or higher than the performance quoted. Performance current to the most recent month-end can be obtained by calling (833) 417-0090. The gross expense ratio for the fund is 1.43%.
View LBAY standardized performance here.
The Fund’s NAV is the sum of all its assets less any liabilities, divided by the number of shares outstanding. The market price is the most recent price at which the Fund was traded.
PRICE DISCOVERY RETURNS AS THE FED RETREATS
March 2022 marks the expected end of the Federal Reserve’s expansion of its balance sheet. With the taper now wrapping up, market participants seem to be facing an entirely different playing field. Perhaps we are returning to a market with true price discovery.
“In the short run, the market is a voting machine but in the long run, it is a weighing machine.” – Benjamin Graham
We believe the recent asset price volatility that has percolated since the end of 2021 will persist throughout 2022 as investors reset market expectations. Market-cap weighted passive investing may struggle as security price dislocations could favor actively managed* fundamental stock picking and long/short portfolios. In our opinion, the $47.5 trillion in Dow Jones US Total Stock Market Index market capitalization3 is ripe for price discovery as rates reset higher and risk appetites wane. We think the high company valuations supported by little-to-no-profits are unlikely to rebound in 2022. Investor portfolios levered long* to this high valuation subset may not recover any time soon.
“There will always be bull markets - followed by bear markets - followed by bull markets” – John Templeton
As market participants prepare for a Fed tightening cycle, global bond and equity markets are declining, while commodity prices are soaring. Here we show that 2022 year-to-date US bond total returns are on pace to be the worst in over forty years4.
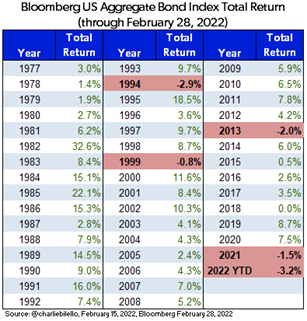
Interestingly, there’s been only four occasions over the past 90+ years of data where US stocks as measured by the S&P 500 Index and US 10 Year Treasury bonds both finished down on the year5. Through February, the S&P 500 had fallen by 8% and the US Aggregate Bond Index had declined by 3.2%.
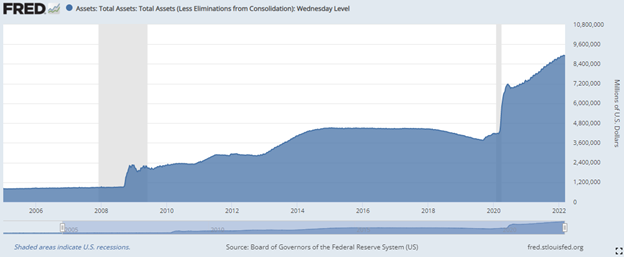
AN $8.9 TRILLION FED-CREATED BALANCE SHEET REMAINS
The week ending March 11, 2022 marked the Fed’s final bond purchases which signifies the end to the more recent expansion of its holdings that began two years ago. Over that two-year time frame the Fed more than doubled its balance sheet from $4.3 trillion to $8.9 trillion6.
“I think we would like to bring the balance sheet back to something consistent with where it was before the crisis which means enough to accommodate Americans demand for currency, plus a modest amount of reserves in the banking system, and that would suggest something under a trillion dollars.” – Ben Bernanke in March 2010
Fed balance sheet expansion and artificially engineered interest rates have led to many unintended consequences, including all-time high US Household debt. In August, we pointed out that there were indications the consumer had started borrowing on credit again. We questioned whether this was buy-now-pay-later because of rising costs, a result of savings depletion, or simply the resumption of past behaviors. We think it is a combination of these factors. The following are a few points released in February about fourth quarter 2021 household debt by the Federal Reserve Bank of New York7:
Here is a visual of fourth quarter 2021 household debt broken out by type:9
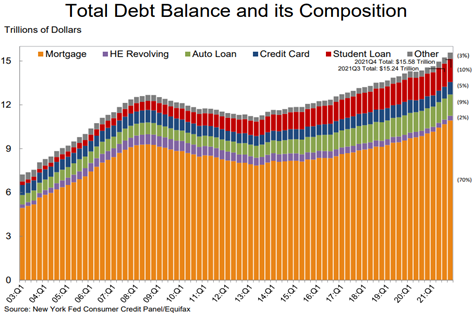
"The total increase in nominal debt during 2021 was the largest we have seen since 2007. The aggregate balances of newly opened mortgage and auto loans sharply increased in 2021, corresponding to increases in home and car prices." - Wilbert Van Der Klaauw, Senior Vice President at the New York Fed8
If you have been shopping for a car or home, you would have come to this conclusion without seeing any data. Interestingly, the number of car loans originated did not deviate much from past trend, but the notional dollar value of loans did. Buyers had to finance higher prices7.
The next question we ask is: will delinquency rates on all types of borrowing start to pick up after the effect of pandemic programs continues to be removed from the equation, including what will happen if student loan data reporting changes after the possible expiration of the programs?
Following the release of the data on household debt, we witnessed something noteworthy in the bond market. By the third week of February, bonds overall were selling off. By the end of the month, the selloff eased slightly in Treasury markets as we started to see volatility pick up given uncertainty surrounding the events evolving in Europe. The flight to safety dynamic picked up steam into the first week of March, but most of the curve is now back behind 2% at the time of writing this piece. Investors seem to have refocused on grappling with questions around how Fed policy tightening will unfold.
PORTFOLIO UPDATE10
After maintaining a net short exposure to the technology sector for the last several months, we recently initiated a long position while covering short positions in Zoom Video Communications, Inc. (ZM) and Shopify Inc. (SHOP) at considerable profit. Over the past several weeks we added long exposure to names in the technology and fintech space.
“Don’t throw the baby out with the bathwater”
We think Fidelity National Information Services Inc (FIS) is quite attractive at current levels and we have made it a core position in our portfolio. Based in Jacksonville, FL, the shares have sold off significantly as technology stocks generally re-rated lower. We think the selling pressure has been a result of outflows from the technology sector and growth factors more broadly; FIS has now declined more than 40% from its 2021 highs and over 17% year to date through the second week of March. Notably, unlike many unprofitable tech “story” stocks, FIS reported 44.1% adjusted EBITDA margins* during its full-year 2021 results11 and generates significant amounts of cash. FIS maintains a $54B market cap12 and provides technology solutions for merchants, banks and capital markets firms globally. Coinciding with its mid-February earnings, FIS announced plans to accelerate its annual dividend growth to 20% per year, beginning this March, and increase its dividend payout to 35% over the next several years. After the recent sell-off, FIS trades for just over 12x consensus 2022 expected earnings* and currently offers more than a 2% dividend yield12.
The short side of the portfolio has been particularly fruitful in 2022. We presently have high conviction in short position SVB Financial Group (SIVB), the parent company to Silicon Valley Bank. SIVB, which in investor relations materials deems itself “the bank of the global innovation economy”, maintains a $30B market cap, trades for around 2x book value and pays no dividend12. SIVB has achieved significant asset and earnings growth over the last several years as many of its venture-backed technology and life science company clients sought growth capital via investor dependent loans. Many of these loans are made to companies with modest or negative cash flows and/or no established record of profitable operations. Exit events, including public offerings and merger and acquisitions activity, contributed significant non-interest revenues and profits at SIVB. For example, in 2021 SIVB produced $2.724B in total pre-tax profits, with nearly half of those profits generated from gains of $0.761B and $0.56B from investment securities and equity warrants respectively. We suspect SIVB stock may decline substantially if those gains prove to be non-recurring in 2022, or if credit quality in their innovative technology loan book sours, both of which we view as likely.
FINAL THOUGHTS
Despite two consecutive down months for broader US equity markets to begin 2022, the Fund performed quite well posting positive performance in both January and February. We are finding many compelling ideas both long and short and we look forward to continuing our dialogue in the weeks and months ahead.
