The Leatherback Long/Short Alternative Yield ETF (LBAY) (the “Fund”) net asset value (NAV) declined by 5.44% in February, compared to a decline of 2.44% for the S&P 500 Index. LBAY paid its twenty-seventh consecutive monthly distribution, at $0.075 per share in February. This is a 2.41% SEC yield versus the S&P 500 Index dividend yield of approximately 1.72%, and the 10-Year US Treasury yield of 3.923%. Year to date as of February 28, 2023, NAV for the Fund has declined 4.88%, compared to an advance of 3.69% for the S&P 500 Index. NAV performance for the Fund to date since inception (November 16, 2020) has produced a 48.69% cumulative total return and a 18.96% annualized total return.
The performance data quoted represents past performance. Past performance does not guarantee future results. The investment return and principal value of an investment will fluctuate so that an investor’s shares, when sold or redeemed, may be worth more or less than their original cost and current performance may be lower or higher than the performance quoted. Performance current to the most recent month-end can be obtained by calling (833) 417-0090. The gross expense ratio for the fund is 1.32%.
View LBAY standardized performance here.
The Fund’s NAV is the sum of all its assets less any liabilities, divided by the number of shares outstanding. The market price is the most recent price at which the Fund was traded.
BEWARE THE IDES OF MARCH
The first two and a half months of 2023 have been eventful! Anyone who had money deposited at a financial institution in 2008 has been having flashbacks. Most readers likely recall the 2007 to 2009 period; the first domino to fall in the global financial crisis occurred when New Century failed in early March in 2007, surprising most financial market investors. A year later, on March 16, 2008, Bear Stearns was rescued by JP Morgan. According to the Federal Deposit Insurance Corporation (FDIC), from 2008 through 2012, four hundred sixty-five banks were closed with twenty-five banks failing in 2008 alone.
Fast forward 15 years to March 10 and March 12 of 2023, and we just had two of the largest FDIC failures in history, with tech-focused Silicon Valley Bank and crypto-associated Signature Bank both shuttered by the regulator. Regional bank and specialty finance stocks have declined significantly in the aftermath as every regional bank’s financial stability is seemingly questioned. Meanwhile, market participants have witnessed a resurgence in tech and high beta* stocks led by the NASDAQ Composite** and The Technology Select Indexes,** both rising almost 10% year to date through February. Both are continuing their relative outperformance through the month of March. Bitcoin has risen from $16,539 at year end 2022, to around $28,000 on March 20th.
In our opinion, the financial market price discovery mechanism that was restored in 2022 has been temporarily broken in 2023 as investors expect bailouts, interest rate cuts and a return to “free” money. The market dynamic seems to be following the old playbook of buying long duration* growth equities while shunning value-oriented securities. Interestingly, long duration fixed income securities, “safe” US Treasuries and Agency mortgage-backed securities (MBS) are what appear to have created the March bank panic. The current market environment strikes as a fluid one, and we envision many opportunities both long and short as the year plays out. We think investors that are re-running the same plays during the last run in the market will likely be disappointed.
FED INDUCED INTEREST RATE RISK - BEWARE OUR DECISION MAKERS
“Will I say there will never, ever be another financial crisis? No, probably that would be going too far. But I do think we’re much safer, and I hope that it will not happen in our lifetimes, and I don’t believe it will.” - Janet Yellen, June 2017
“My views on Jay Powell are well-known at this point. He has had two jobs. One is to deal with monetary policy. One is to deal with regulation. He has failed at both.” – Elizabeth Warren, March 2023
“I need to make some money.” – Barney Frank (Co-sponsor of Dodd-Frank Wall Street Reform) on why he joined the Board of Signature Bank
Below we show a chart of unrealized losses on investment securities held on regulated bank balance sheets at year end 2022. The simple bond math learned in Finance 101 is that higher rates drive lower bond prices. The US Federal Reserve Board’s (the Fed) 450 basis points* of interest rate increases over the last 12 months is believed to have directly caused the higher market interest rates and respective bond markdowns (losses) shown in the table3.
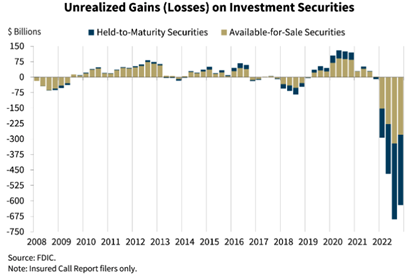
The concerning element of this graphic is that these investment securities are also comprised of US Treasuries and Agency backed MBS, which are perceived to carry little to no credit risk. While the Fed’s rate increases directly contributed to these losses, we note that the Fed’s dual mandate is to pursue maximum employment and price stability; it is not the Fed’s job to provide interest rate hedges to financial institutions.
We can’t help but ask, what happens when riskier assets, such as commercial real estate, venture capital debt, and other illiquid securities are marked to market? With the Silicon Valley Bank $200+ billion balance sheet no longer available, will other financial institutions step in to finance the startup community? Will the shadow banking industry that provides funding for car loans, RV loans, boat loans, and other asset backed financing have tighter lending standards, and could this be the beginning of a larger credit crunch?
EARNINGS AND EMPLOYMENT
Now this takes us to the looming questions: Can the Fed continue to raise rates and execute quantitative tightening to reduce inflation and thread the needle? Will they be able to orchestrate a soft landing, or will these policies force the economy into recession (hard landing)? Could it be neither, and in what may be the least ideal outcome from the policy-makers perspective, will the economy continue to grow with inflation continuing to run hot?
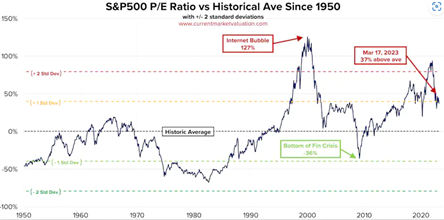
We still think “The Two E’s” (earnings and employment) that we articulated in our February 2023 piece are what will make the difference. According to FactSet’s latest figures, S&P 500 Earnings Per Share for calendar year 2023 are estimated to be $222.75.4 At the time of this writing, this equates to a roughly 17.5x price multiple at current S&P 500 levels, and we look to the recent uptick in that metric that has taken place as seen in the below chart5.
“I’ve been on the Street [since] 1980 [and] not one bear market has ever traded above nine times to 14 times the previous peak earnings,” - James Chanos
FactSet estimates the Financial sector will grow by 12.8% in calendar year 2023, while expecting Consumer Discretionary to grow by 25.2%4. We think there is a high likelihood of Financial sector earnings growth disappointment in light of recent events. Additionally, we are unable to ignore some of the largest market capitalization companies in the S&P 500 which are cutting costs and reducing headcount. Perhaps these downsizing efforts may be driving the expected earnings growth, but how does that portend to consumer discretionary spending? We highlight what we view as a few noteworthy headlines and news from a sample of those companies from the past several months:
Silicon Valley Bank had over 8,000 employees and Signature Bank employed more than 2,000; it’s unclear how many will be retained. We have to wonder what it will look like if we end the final months of 2023 and rates are still lofty, the economy continues its slowdown, and the employment picture has dimmed.
PORTFOLIO REVIEW10
The Fund portfolio has struggled during the first few months of 2023 as many of our long positions have underperformed, while our short positions have simultaneously outperformed the overall market. While we view the phenomenon as temporary – see our comments above regarding the market price discovery mechanism- we have made changes in the portfolio. Notably, we recently covered our SVB Financial Group (SIVB) short position at a significant profit. While it contributed meaningful positive attribution, our portfolio detracted from long positions in The Charles Schwab Corporation (SCHW), Fidelity National Information Systems, Inc (FIS) and Popular, Inc (BPOP). We have reduced our position in SCHW, yet still remain positive on the name. We maintain long exposure to FIS and believe the selloff is overdone. We eliminated our position in BPOP as the regulatory environment is too difficult to predict; are BPOP’s deposits insured or not? Finally, we continued to risk-manage many short positions by covering them back within a target of approximately 2% level exposure limits. It is important to note our conviction remains in these short positions, but we feel it is prudent to remain rigorous in risk management.
View LBAY top 10 holdings here. Holdings are subject to change. Characteristics and metrics of the companies shown are for the underlying securities in the fund’s portfolio and do not represent or predict the performance of the fund. There is no guarantee that a company will pay or continually increase its dividend.
FINAL THOUGHTS
We hope our investor partners enjoy our monthly perspectives. We are finding many compelling ideas both long and short and we look forward to continuing our dialogue in the weeks and months ahead.
