The Leatherback Long/Short Alternative Yield ETF (LBAY) (the “Fund”) net asset value (NAV) declined by 1.44% in March, compared to an advance of 3.67% for the S&P 500 Index. LBAY paid its twenty-eighth consecutive monthly distribution, at $0.075 per share in March. This is a 2.55% SEC yield versus the S&P 500 Index dividend yield of approximately 1.68%, and the 10-Year US Treasury yield of 3.47%. Year to date as of March 31, 2023, NAV for the Fund has declined 6.25%, compared to an advance of 7.50% for the S&P 500 Index. NAV performance for the Fund to date since inception (November 16, 2020) has produced a 46.55% cumulative total return and a 17.50% annualized total return.

The performance data quoted represents past performance. Past performance does not guarantee future results. The investment return and principal value of an investment will fluctuate so that an investor’s shares, when sold or redeemed, may be worth more or less than their original cost and current performance may be lower or higher than the performance quoted. Performance current to the most recent month-end can be obtained by calling (833) 417-0090. The gross expense ratio for the fund is 1.32%.
View LBAY standardized performance here.
The Fund’s NAV is the sum of all its assets less any liabilities, divided by the number of shares outstanding. The market price is the most recent price at which the Fund was traded.
THE S&P FIVE, SIX, SEVEN, EIGHT...
Over the past few years, we have been impressed by the handful of companies driving US Equity market Indices. An analogy can be made between fruit juice “from concentrate” when compared to juice that is “not from concentrate”. From concentrate juices have most of the liquid content removed, which may shrink the size of packaging for cheaper storage and transport but may simultaneously remove some of the nutrients and other beneficial components of the original fruit. Once the concentrate arrives at a bottling plant it is ready for processing back into liquid form. The concentrate is rehydrated and may also be enhanced with additives, some of which may be artificial, replacing what may have been stripped during the concentration filtering process.
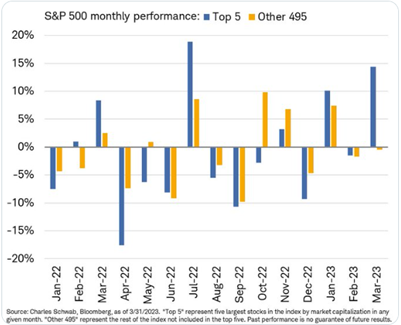
What comparison are we drawing to the market? We think liquidity may be in the continuous process of unintentional removal and wonder if broad market measures are in fact artificially characterized by such a diminished cohort. We go so far as to think the small handful of firms have become the definition of the equity market itself. During the first quarter of 2023 a group of eight names in the “FAANG”-related complex (Meta, Apple, Amazon, Netflix, Alphabet, Microsoft, NVIDIA and Tesla) were mainly responsible for driving the gains in the S&P 500; in fact, excluding the top five weighted names in the Index the return for the month of March would have been negative3!
“…the 10 largest stocks in the S&P 500 were responsible for 90% of the index's first-quarter increase…” – Liz Ann Sonders & Kevin Gordon3
Initially, back in August of 2021, we were intrigued by the concentration of the big five constituents in the S&P 500 Index and took the view that too many investors and passive managers were piled into this small group of names. We are now seeing more market pundits and participants discussing the trend and pointing out how recent rallies and sell-offs in markets are likely to be driven largely by only a few tickers. Seemingly these days, the task of beating the market can boil down to attempting to outperform less than ten companies. At the time of writing this piece, the top weighted nine companies made up more than 25% of the S&P 5004. Taken one step further, besting the market can concentrate within segment, as three of the top four weights in the Index to end the first quarter were in one sector: information technology5. The next visual illustrates how the five largest stocks in the index by market capitalization have contributed to monthly performance over the past year-plus, when compared to the rest of the components3.
What does the outperformance seen in the largest names foreshadow? We think it could be a potential downturn. The concentration phenomenon could trip up the market dynamic into a possible multiple contraction period, paired with what may be coming down the pipe for earnings quality during this cycle. We have started to see and continue to expect many companies to meet or slightly exceed their quarterly estimates. We are having a difficult time getting excited about these beats for many fan-favorite businesses, as we think the hurdles for the beats have been meaningfully lowered. We also expect to hear from management teams that remain optimistic about future growth, but less enthusiastically than in prior quarters. We think many of the question-and-answer sessions will be littered with hints of margin contraction as pricing power to consumers begins to wane, as well as nods to the persistence of cost pressures and unanticipated headwinds. We think there are well-run businesses that exhibit attractive valuation metrics but have been out of favor as of late when compared with the recent concentrated market leaders. We imagine many of these companies may begin to find favor again over the next several quarters.
PORTFOLIO REVIEW6*
The fluidity of market sentiment has been dynamic. Market expectations have ranged from rate hikes to cuts, hard versus soft economic landings, and Federal Reserve balance sheet shrinking to growing during the recent bank panic. While we cannot predict short term sentiment shifts, we are optimistic we can add alpha by identifying quality companies that can compound capital over time. We continue to be bullish on long ideas in the medical technology space with core positions in Zimmer Biomet Holdings, Inc. (ZBH), Medtronic, PLC (MDT) and Johnson & Johnson (JNJ). Near term, we imagine there is pent up demand as many put off elective surgeries such as knee and hip replacements during the COVID pandemic, and long-term we are bullish on the space as demographic trends such as an aging population provide secular tailwinds for medical technology demand. We think valuations are reasonable and we believe there is capacity to increase current dividend payouts.
On the short side of the book, we are skeptical about the outlook for consumer spending, and are short securities with what we think are rich valuations that are tied to the US consumer. Core short positions include retailers Five Below, Inc. (FIVE) with a 35x Estimated Price to Earnings Ratio (P/E), Ollie’s Bargain Outlet Holdings, Inc. (OLLI) at 25x P/E, and cooler maker YETI Holdings, Inc. (YETI) with an 18x P/E. Next, we continue to maintain short positions in REITs tied to industrial warehouses and data centers; we think valuations are rich and there has been an overbuild in both real estate sectors.
View LBAY top 10 holdings here. Holdings are subject to change. Characteristics and metrics of the companies shown are for the underlying securities in the fund’s portfolio and do not represent or predict the performance of the fund. There is no guarantee that a company will pay or continually increase its dividend.
FINAL THOUGHTS
We hope our investor partners enjoy our monthly perspectives. We are finding many compelling ideas both long and short and we look forward to continuing our dialogue in the weeks and months ahead.
