The Leatherback Long/Short Alternative Yield ETF (LBAY) (the “Fund”) net asset value (NAV) increased by 1.08% in February, compared to an increase of 5.34% for the S&P 500 Index. LBAY paid our thirty-ninth consecutive monthly distribution, at $0.076 per share in February. This is a 2.43% SEC yield versus the S&P 500 Index dividend yield of approximately 1.40%, and the 10-Year US Treasury yield of 4.251%. Year to date as of February 29, 2024, NAV for the Fund increased 0.54%, compared to an increase of 7.11% for the S&P 500 Index. NAV performance for the Fund to date since inception (November 16, 2020) has produced a 43.87% cumulative total return and a 11.71% annualized total return.

The performance data quoted represents past performance. Past performance does not guarantee future results. The investment return and principal value of an investment will fluctuate so that an investor’s shares, when sold or redeemed, may be worth more or less than their original cost and current performance may be lower or higher than the performance quoted. Performance current to the most recent month-end can be obtained by calling (833) 417-0090. The gross expense ratio for the fund is 1.24%.
View LBAY standardized performance here.
The Fund’s NAV is the sum of all its assets less any liabilities, divided by the number of shares outstanding. The market price is the most recent price at which the Fund was traded.
NOT YOUR FATHER'S STOCK MARKET
Historically, individual stocks and the stock market have primarily been a thoughtful discounting mechanism of future economic profit and business prospects. In our opinion, equity markets have dwarfed into money flow machines primarily based on market cap weighted structures that have created a bubble-like feedback loop into mega-cap stocks such as the Magnificent Seven – Amazon, Apple, Alphabet, Meta, Microsoft, Nvidia and Tesla. “The total assets under management in exchange traded funds and notes along with passively managed mutual fund strategies reached a combined $13.29 trillion at the end the December, nudging above the $13.23 trillion in active* assets, according to Morningstar.”3 Can anyone guess what the cumulative market cap of the Magnificent 7 was at the beginning of February? $12.5 Trillion4! Morningstar may have to issue another report soon: “Magnificent Seven overtakes Passive and Active Funds.”
In our opinion, it’s clear the distorted market structure has created a disconnect between equity markets and intrinsic valuations. We believe stocks are no longer priced for valuation, but priced due to money flows.
PASSIVELY AGGRESSIVE
“Oh, no question, I view the markets as fundamentally broken…Value is just not a consideration for most investment money that’s out there. There’s all the machine money and algorithmic money, which doesn’t have an opinion about value…Passive investors have no opinion about value.”5 – David Einhorn
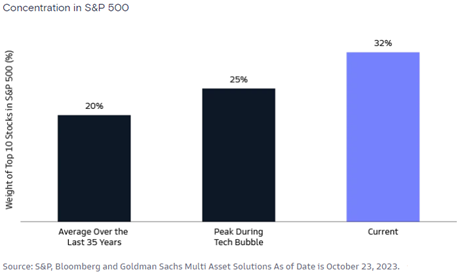
At the time of this writing, the S&P 500 Index rests at its all-time high north of 5,000 and maintains a market capitalization of over $42 trillion.6 The near constant discussion of the Magnificent 7 stocks relative to the rest of the market continues to perpetuate investor sentiment. Per a recent report on Bloomberg entitled “Magnficent or Marxist? Passive Investing on Trial: John Authers”, the US stock market now comprises about 70% of world market capitalization.7 With that said, the S&P 500 now has the largest concentration in nearly the last half century with the top 10 holdings at 32% of the index!8
The flows have been most pronounced in the information technology and communications sectors which together comprise more than 38% of the S&P 500 index9. We believe the flow money machine has created distortions in the stock market. While there’s no crystal ball to foresee how this will end, we cannot help but wonder.
“Tech companies are generating earnings, but valuations of many tech stocks have been driven higher based on earnings expectations…The question in 2024 is whether these companies can maintain a level of earnings growth that lives up to current stock prices.”9 – Rob Haworth, US Bank Wealth Management
PORTFOLIO REVIEW10*
We think passive flows are creating opportunities in individual securities both long and short. We believe investing in companies that demonstrate a tangible path to value creation is paramount given today’s passive-heavy market landscape. Notably, we have minimal long exposure to the technology and communications space as we see a dearth of attractively valued securities. Specifically, we are focused on companies that are optimizing their capital structures through debt paydown and share repurchases, as well as companies growing their dividends. Additionally, we look for companies that have potential catalysts, such as divestitures and management shakeups.
One of our core long holdings continues to be Fidelity National Information Services, Inc. (FIS) which currently maintains over a $39B market cap and an over 2% dividend yield. On February 1st, FIS announced the completion of the sale of a majority stake in its Worldpay business to GTCR which resulted in greater than $12B of net cash proceeds. FIS announced that it will be using the cash proceeds to pay down debt and repurchase at least $4B of shares over the course of 2024. FIS is presently a top 10 holding in the Fund.
Next, we are long defense contractor L3 Harris Technologies (LHX), a $40B market cap company that trades for a mid-teen multiple and sports an over 2% dividend yield. LHX stock has traded sideways since long-time CEO William Brown stepped down at the end of 2021; notably from 2011 through 2021 LHX stock rose from under $40 a share to over $200 per share with Brown at the helm. Interestingly, LHX announced in December multiple actions to enhance corporate governance to improve operations with a focus on enhancing profit margins. LHX and activist investor D.E. Shaw entered into a cooperation agreement which has resulted in LHX adding Brown as Special Advisor to a newly formed Business Review Committee. Additionally, the company added Kirk Hachigian, former Chair and CEO of JELD-WEN Holding, Inc., and William Swanson, retired Chair and CEO of Raytheon, to its Board.11 We are optimistic the company will see near and medium-term catalysts, and we believe the guidance the Company has provided for 2024 is conservative and should be achievable.
On the short side of the ledger, we currently maintain short exposure across nineteen individual securities, with a current gross short exposure that is slightly over 30%. Without a doubt, navigating the short book has been difficult over the past twelve months. Yet, we have had some recent winners and losers. Yeti Holdings, Inc. (YETI) has been a winner after reporting weak results; increased competition in the drinkware category coupled with overall reduction in demand for YETI products resulted in the stock falling approximately 20% after its earnings report. We partially covered our position as the stock traded lower. Next, we covered short positions in Netflix, Inc. (NFLX) and Deckers Outdoor Corporation (DECK) after their earnings releases surprised us to the upside.
View LBAY top 10 holdings here. Holdings are subject to change. Characteristics and metrics of the companies shown are for the underlying securities in the fund’s portfolio and do not represent or predict the performance of the fund. There is no guarantee that a company will pay or continually increase its dividend.
FINAL THOUGHTS
We hope our investor partners enjoy our monthly perspectives. We are finding many compelling ideas both long and short and we look forward to continuing our dialogue in the weeks and months ahead.
