The Leatherback Long/Short Alternative Yield ETF (LBAY) advanced by 3.72% at NAV in February, compared to 2.76% for the S&P 500 Index. Cumulative inception to date, the Fund has returned 7.02%. LBAY paid its third consecutive monthly distribution of $0.06 per share this month, which equates to a 3.45% SEC yield versus the S&P 500 Index estimated 12-month dividend yield of approximately 1.5%.
If there has been a recurring theme in conversations with friends, family, investors, and colleagues, it is how much everyone just wants to get out. We don’t mean get out of the market, we mean get out literally, as in get outside and go somewhere.
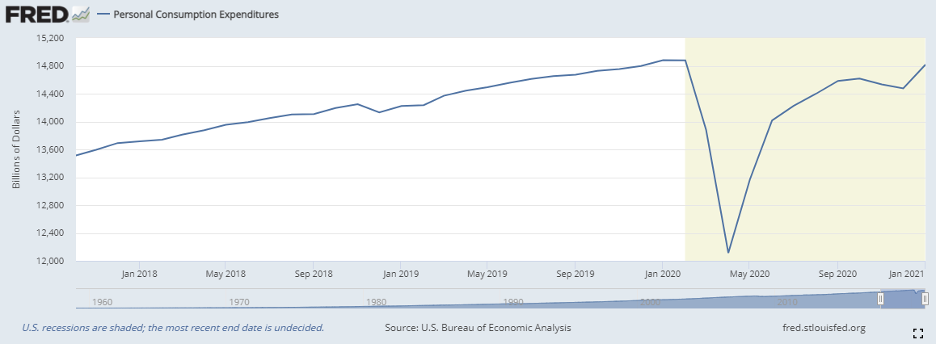
As we lap the anniversary of the economy shutting down, we expect this pent-up consumer demand to outpace where we were in late 2019 and early 2020, pre-COVID. As shown in the chart below, January 2021 personal consumption spending was higher than 2019, and approaching 2020 pre-pandemic levels.
Chart: Personal Consumption Expenditures in Billions of Dollars, Seasonally Adjusted Annual Rate.
With that in mind, LBAY maintains long positions in RV maker Thor Industries Inc (THO), ski resort operator Vail Resorts Inc (MTN) and convertible preferred shares in theater owner EPR Properties (EPR). We expect these companies to benefit from increased consumer activity.
As the economy reopens and strengthens, Treasury yields have spiked, catching the attention of investors. On February 25th, The Treasury held a 7-year note auction that saw an unexpected bid-to-cover and tail. This caused the belly of the curve to back up over 20 bp at one point during the trading day. We have now seen the yield on the 5-year trading above 0.75%, and the 10-year go from just under 1% at the beginning of 2021 to dancing back and forth between 1.5% and 1.6% at the time of writing this piece. This is approaching the yield level at which the 30-year long bond was trading to start the year.
Historically, a 10-Year yield of 1.5% would not garner much, if any, attention. However, combined with recent comments from Federal Reserve Chair Jerome Powell, an increase in the pace of economic reopening could, “create some upward pressure on prices.” This clearly has the specter of inflation and rising interest rates back on people’s minds.
Fixed income participants were not alone. Equity markets were clearly rattled as well. This was reflected in tech share prices, which are sensitive to interest rates due to the discounting mechanism applied to valuations. We are seeing the shares of many of the bond proxies underperforming. As the markets and expectations recalibrate, we expect to see some interesting opportunities worth exploring through the lens of a potentially more inflationary and volatile interest rate environment.
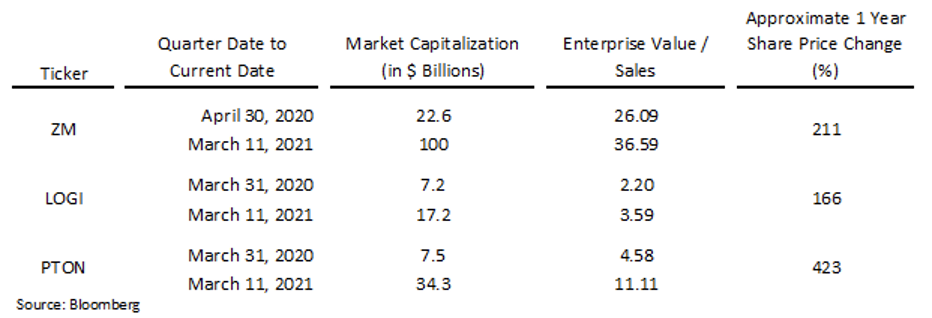
Turning our attention back to the consumer environment, the flip side to the suddenly mobile American consumer is clearly going to be some pain among the work/live/stay-at-home contingent, which does not bode well for companies like Zoom Video Communications (ZM), Logitech International (LOGI) and Peloton Interactive Inc (PTON). LBAY maintains short positions in each of these companies. As an aside, I have been taking frequent bike rides outside with my family, and it beat sitting indoors on a bike staring at a screen.
Chart: % Change in Share Price (Early days of Pandemic to March 11 Intraday)
From a macro perspective, we expect to see consumer demand increase against a backdrop of supply shortages. We are starting to see anecdotal indications of supply chain disruptions and an upward shift in input pricing pressures. We are witnessing unprecedented easy monetary policy, such as the $1.9 trillion stimulus package and related initiatives in the process of being passed and the clear message from the Fed about leaving rates alone, for now. Given these expectations and observations, we think we have positioned LBAY with mindfulness that realized inflation levels may get much higher than current market expectations imply. This is the reason we own companies that provide us certain factor exposures, such as food prices with Bunge Ltd (BG), agriculture and commodity prices with Nutrien Ltd (NTR) and Potlatchdeltic Corp (PCH), and energy prices with Exxon Mobil Corp (XOM).
As we close out another exciting month, we can say with certainty that we are part of the group that cannot wait to get out, see relatives, visit friends, travel to the places we have been missing, and do the things we’ve been waiting to do. We will be doing so safely, as we hope you will as well, and we look forward to continuing our dialogue in the weeks and months ahead.
