The Leatherback Long/Short Alternative Yield ETF (LBAY) (the “Fund”) net asset value (NAV) advanced by 1.14% in April, compared to an 8.72% decline for the S&P 500 Index. LBAY paid our seventeenth consecutive monthly distribution, at $0.065 per share in April. This is a 2.63% SEC yield versus the S&P 500 Index dividend yield of approximately 1.51%, and the 10-Year US Treasury yield of 2.937%. Year to date as of April 30, 2022, NAV for the Fund has returned 12.94%, compared to a decline of 12.92% for the S&P 500 Index. NAV performance for the Fund to date since inception (November 16, 2020) has produced a 44.26% cumulative total return and a 28.71% annualized total return.
The performance data quoted represents past performance. Past performance does not guarantee future results. The investment return and principal value of an investment will fluctuate so that an investor’s shares, when sold or redeemed, may be worth more or less than their original cost and current performance may be lower or higher than the performance quoted. Performance current to the most recent month-end can be obtained by calling (833) 417-0090. The gross expense ratio for the fund is 1.43%.
View LBAY standardized performance here.
The Fund’s NAV is the sum of all its assets less any liabilities, divided by the number of shares outstanding. The market price is the most recent price at which the Fund was traded.
FOCUS ON THE CENTRAL BANKS
What is it like when the Central Banks lose credibility? We are collectively watching the answer to this question in real time as risk is being repriced throughout nearly every corner of the market. It’s a challenge to find an asset class that is positive to start the year outside of what you can physically hold in your hands. For more than a decade, risk takers (investors) became accustomed to a world flush with liquidity, with Pavlovian conditioning that easy money would ride in to save the day and rescue markets if they started becoming unhinged. This time around, reality is setting in that policy mistakes have caused unintended disarray and Central Bankers are panicking to achieve a reduction in inflation; the hawkish tone is resonating, and the liquidity backstop may be on the verge of evaporation. We believe it is highly unlikely the Fed will slash interest rates and flood the system with printed money to bid up asset prices again.
In our last commentary, we made the call that equities would follow the lead of fixed income markets with increased volatility and downward pressure. Americans already in disbelief at their skyrocketing budgets had to then open their statements this month. For the first time in what could be over a decade many are experiencing the unpleasant reminder of what it feels like to see red numbers. As we anticipated in our September 2021 commentary, there is increasing blowback directed at bureaucrats from the public. How do we know this?
CREDIBILITY – EXPEDITIOUSLY FROM THE ROOFTOP
All one needs to do is listen to the first 30 seconds of the latest FOMC meeting on May 4th. The Fed is acutely aware of the difficulties being experienced by the American people and is appealing to the masses to assuage the damage that has been done. Chairman Jerome Powell even borrowed some verbiage from an 80’s movie on how we can “lean on” the Fed while they target out-of-control prices.
“Inflation is much too high, and we understand the hardship it is causing, and we’re moving expeditiously to bring it back down.” – Jerome Powell
Interestingly, the urgency with which this change in tack is taking place is right on the heels of the first negative Annualized Quarter over Quarter Gross Domestic Product reading since late 2020. Will the Fed be able to achieve their mandate by continuing to raise the target Federal Funds rate and “significantly” reducing the size of their balance sheet? Asset markets seem full of doubt and are currently wrestling for the answer. Either way, others in the marketplace appear to agree with our credibility perception. Here are a couple anecdotes:
“Central banks have a little bit of a credibility problem. Taking the optionality of 75 basis points* off the table was an unforced error…3” – David Tepper
“You cannot come on TV and speak about all the uncertainties and then rule out a certain policy response -- 75 basis points*,…We don’t know enough about the path of inflation to rule out certain policy actions at this point.4” – Mohamed El-Erian
HOW DID WE GET HERE?
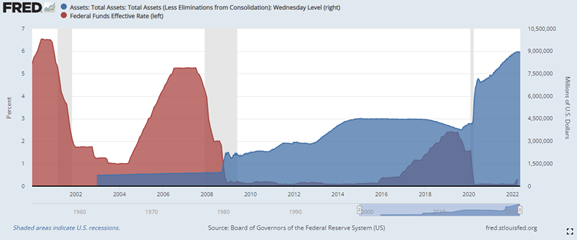
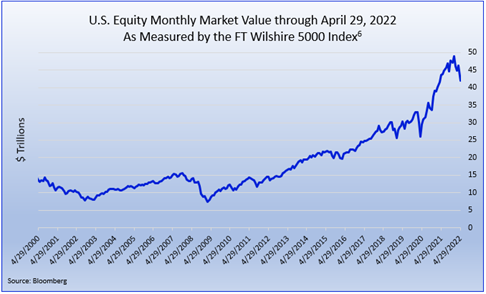
We think the below two visuals do a pretty nice job summarizing the answer to the above title question. The top chart depicts the Fed’s recent Zero/Near-Zero-Interest-Rate Policy (left axis) as well as the size of the Fed’s balance sheet (right axis)5. Pair this with the bottom chart6, and we’ll let you decide if there is a coincidence with the increasingly parabolic rise that was seen in monthly equity market values.
WHERE ARE WE HEADED, AND IS THERE ANYWHERE TO HIDE?
You can see in the above equity monthly market value graphic what started happening recently following the change in tune and policy response. Unfortunately, what we discussed in last month’s piece has brought about even more pain in broader markets. In the fixed-income world, pundits were very excited with the prospects of the US Treasury 10-year yield climbing to 2%. Not only did that happen, but the yield ricocheted higher and much more quickly than most had foreseen. Notably, the entire yield curve apart from the shortest maturities have recently risen higher than 3% (the 3-year yield nearly hit the level as well). We continue to witness yields on several maturities see-saw back and forth above and below the 3% level as this is being written.
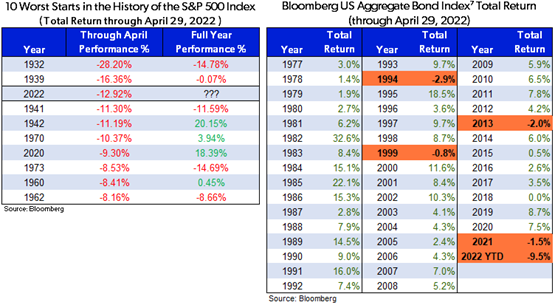
Broader US Equities are suffering with the S&P 500 Index beginning the year with it’s top 3 worst starts in history. Bonds are no exception and are in the throes of a market looking for certainty. Measured by a US broad-based index, bonds may be heading for the worst start in decades.
We find it curious that we are potentially in the early innings of this new Federal Reserve policy stance and are mindful that there’s a lot of credibility risk out there!
“Further surprises may be in store” – Jerome Powell
PORTFOLIO UPDATE*8
We have utilized the recent market weakness to significantly increase our long position in The Charles Schwab Corporation (SCHW). SCHW has been a core portfolio holding since our launch in November 2020 and is now a top ten position in the Fund. With over $7 trillion in client assets under management, the company is the largest publicly traded brokerage firm with a scale and level of service that we think is unparalleled. We have long admired the secular tailwinds of their business model and the company’s profitability reflects its large moat as it maintains mid-40% operating margins and a 26% return on tangible common equity. The company currently trades at a mid-teens price-to-earnings multiple and pays an approximately 1.2% dividend yield9. It is in the process of trying to strip out significant costs from the TD Ameritrade acquisition, and we believe the company’s operating leverage and margins should improve moving forward. While it is not immune to a broad re-rating lower in risk assets, we anticipate it should benefit immensely from higher short-term interest rates. We expect SCHW to be a core holding for the foreseeable future.
FINAL THOUGHTS
We hope our investor partners have been pleased with the Fund and have enjoyed our monthly perspectives. We are finding many compelling ideas both long and short and we look forward to continuing our dialogue in the weeks and months ahead.
