The Leatherback Long/Short Alternative Yield ETF (LBAY) (the “Fund”) NAV advanced by 0.65% in July, compared to an advance of 2.38% for the S&P 500 Index. LBAY paid our eighth consecutive monthly distribution of $0.06 per share. This is a 3.69% SEC yield versus the S&P 500 Index dividend yield of approximately 1.33%, and the 10-Year US Treasury yield of approximately 1.22%. Year to date as of July 31, 2021, NAV for the fund has returned 14.26%, compared to 17.99% for the S&P 500 Index. Cumulative since inception (November 16, 2020) performance to date, NAV for the Fund has produced a 19.25% total return.
The performance data quoted represents past performance. Past performance does not guarantee future results. The investment return and principal value of an investment will fluctuate so that an investor’s shares, when sold or redeemed, may be worth more or less than their original cost and current performance may be lower or higher than the performance quoted. Performance current to the most recent month-end can be obtained by calling (833) 417-0090. The gross expense ratio for the fund is 1.09%.
View LBAY standardized performance here.
The Fund’s NAV is the sum of all its assets less any liabilities, divided by the number of shares outstanding. The market price is the most recent price at which the Fund was traded.
After two years of very little travel outside of our sphere in Florida, we recently made the long drive to the Midwest. We enjoyed a nice long visit with family and friends, many of whom we had not seen since the good old days (pre-COVID). It appeared to us as if the entire country decided to simultaneously hit the road and take their long-awaited vacations. With the seemingly coordinated timing of families bursting out of their homes, rather than crowding into them as they had over the past year-plus, the highways were congested at all hours of the day and hotels were booked solid. Good luck showing up and finding an available table at a restaurant – long waits were the norm. The domestic economy seems to be making up for lost time, with many businesses scrambling to adjust to the resumption in consumer demand.
We can attest: “Help Wanted” signs were everywhere. Restaurants, hotels, gas stations, stores, service providers…everyone seems to be hiring. We noted this consistency from Florida to Tennessee, Minnesota to Chicago, and St. Louis to Atlanta. Interestingly, we experienced something we hadn’t before: multiple restaurants, and even a bowling alley, ended up closing their kitchens early. Apologetic managers reluctantly explained they didn’t have staff available to attend to the demand.
DUAL MANDATES: PRICE STABILITY AND EMPLOYMENT… AND THE STOCK MARKET
Mandates are grabbing a disproportionate amount of the headlines lately. One that seems to be receiving less of the attention is the elusive definition of the employment measures the Federal Reserve is looking for. Historically, the market seemed to have an idea of what would cause the Fed to act as part of the dual mandates. As we have indicated in prior commentaries, the ever-shifting unknowns on what will cause the Fed to move this time around continues to have the bond market scratching its head. On the first mandate, the Fed has acquiesced that inflation may be higher, and for longer, than what was a communicated certainty just a few months ago. We are seeing a continuation of pricing pressures in the economic numbers, as well as hearing about them more consistently as part of the earnings cycle.
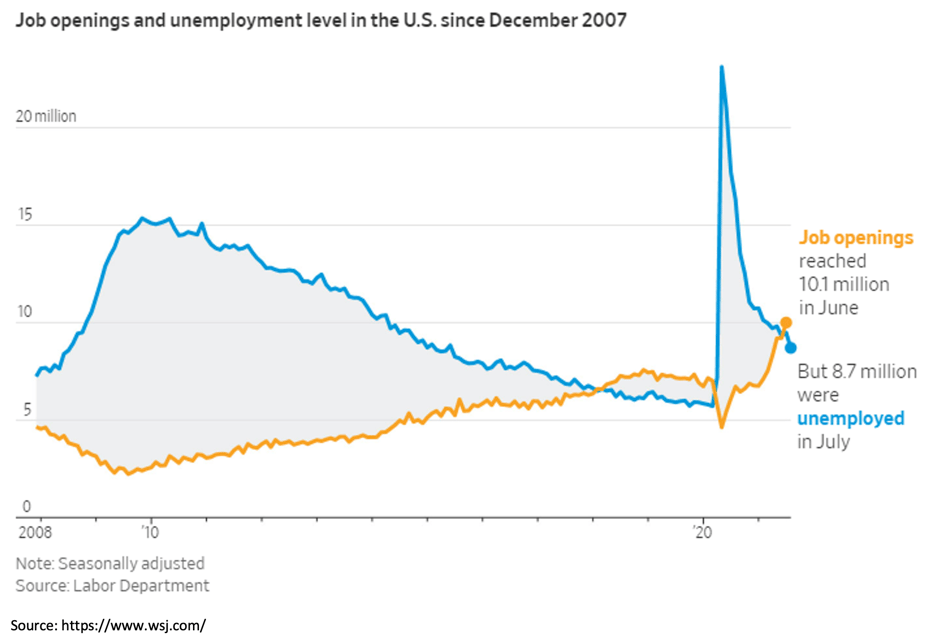
For the second mandate, has the missing piece of the Fed’s puzzle been found and will the improvements witnessed in recent employment measures be the catalyst that causes the Fed to adjust policy? The latest few payroll numbers are certainly receiving quite a bit of media attention. The unemployment rate has continued to trend down from the spike last year, and we note that job openings have surged above 10 million for the first time ever. This number has climbed every month in 2021.
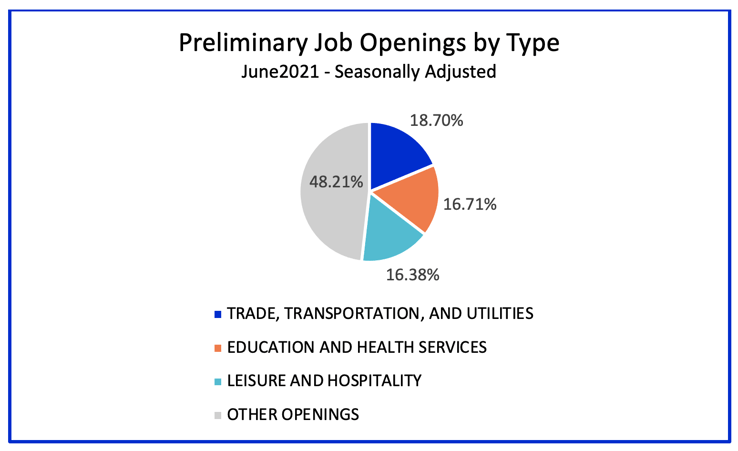
Is this structural in nature with a paradigm shift resulting in a more permanent glut of jobs available compared to the number of workers willing to accept them? Are some of the workers that left or lost their jobs over the past year or so never to return to the labor force? Are the available jobs simply for work many Americans are no longer willing to perform? We note in the chart below that 3 of the top 4 categories of job openings include components of transportation, health care, and accommodation and food services, the total of which make up more than half of the preliminary openings as of June 20213. We think the answers to these questions will take some time to play out, especially given some of the potential impacts around pandemic benefits approaching expiration.
MORE OF THE SAME
With the backdrop of a buzzing Main Street economy, labor market green shoots or woes (depending on your point of view), and a Fed that seems to be disproportionately impacting markets, Wall Street has witnessed more of the same. Interest rates fell further across the curve (although they are backing up slightly at the time of writing this piece), while long duration* equities (growth stocks) have continued the reversion higher in valuations and traditional value stocks have lagged. Market participants seem to be hanging on to the Fed’s narrative that inflation is transitory. However, as pointed out by a market-watcher, transitory simply means not permanent, rather than what many are interpreting it currently as meaning short-lived.
“Every single Fed member has a Bloomberg terminal. And the running joke/truth is every time they give a speech, every time they talk about anything at the Fed, they all go back and watch how the market reacts to their speech… that is a widely known truth, it’s something that they clearly use the market as a barometer of their success.” -Kyle Bass
We also are back in the throes of a potential show-down on the debt ceiling, with the Secretary of the Treasury jawboning as an attempt to get both parties in front of the impending situation rather than reacting to it, as is usually the case. This is the 10-year anniversary of the U.S. credit rating downgrade. Expected Treasury issuance is slowing which may impact supply, and it is unclear how the Fed is affecting rates across the curve with open market purchases. None of this seems to matter to the consumer, who appears to be borrowing on credit again. It can be debated as to whether this is buy-now-pay-later as a result of rising costs and/or potential savings depletion, or if this is simply the resumption of past behaviors.
STOCK MARKET INEQUALITY: 1% OF S&P 500 COMPANIES CONTROL OVER 20% OF THE MARKET CAP
In the Fed’s world of near-zero interest rate transitory inflation policy and the curve re-compression seen in July, we recently witnessed a fifth company (Facebook Inc) enter the trillion-dollar market cap regime. Take a look at the below table4,5,6:
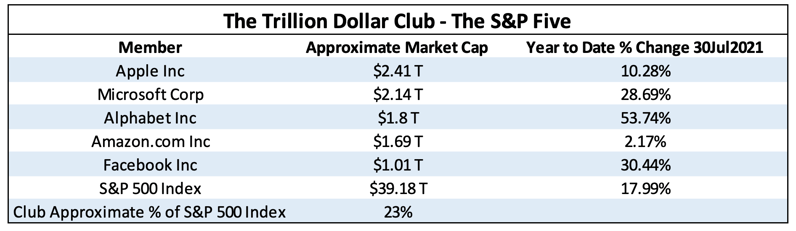
The S&P 500 Index has become as concentrated as it has been in its history. The top-heavy index continues to touch new highs with five stocks, which now represent over 20% of the index, guiding it higher. “The market” as defined by the S&P 500 Index is no longer a diverse measure of the economy, but a heavily concentrated exposure to mega-cap growth companies. In our opinion, too many investors are piled into this small group of favorite names, and many portfolio managers are left with no choice but to follow along and participate. The lack of breadth in the market is a bit disconcerting and presents a nice fertile set up for both long and short opportunities outside of the “S&P 5”.
PORTFOLIO UPDATE
Given recent persistent inflationary signals, and our view that the flare up in the delta variant of COVID-19 will not cause lingering negative impacts on the economy, we see the possibility that cyclical and value-oriented securities that lagged for the past few months may start to lead again. We think that growth and unprofitable tech and story stocks may begin to underperform the broader market. We continue to be long names that may benefit from inflationary undertones such as Bunge Ltd (BG) and Exxon Mobil Corp (XOM). We continue to be long Carrier Global Corp (CARR), which has seen increased demand for its solutions to make indoor environments safe post-COVID-19. Additionally, we initiated two short positions in early-August tied to the used-car market, one of the areas where inflation has been truly transitory. We think used car prices may follow the trajectory of lumber prices and Carvana Co (CVNA) and CarMax Inc (KMX) may suffer price declines in its aftermath.
Finally, back to school is upon us, and the desire to get our futures back-to-normalcy is at the forefront. After a few months of experiencing what seemed like the way it used to be, our team is hopeful that the threats of COVID re-emerging are not as bad as feared. We are optimistic we will be able to refer to the times ahead as post-COVID.
No matter what the outcome is, we think there are opportunities to explore, and we look forward to continuing our dialogue in the weeks and months ahead.
