The Leatherback Long/Short Alternative Yield ETF (LBAY) (the “Fund”) advanced by 4.03% in April, compared to 5.34% for the S&P 500 Index. LBAY paid our fifth consecutive monthly distribution of $0.06 per share, which equates to a 3.11% SEC yield versus the S&P 500 Index estimated 12-month dividend yield of approximately 1.38%, and the 10-Year US Treasury yield of approximately 1.63%. Year to date, NAV for the fund has returned 15.06%, compared to 11.84% for the S&P 500 Index. Cumulative inception to date, NAV for the Fund has produced a 20.08% total return.
The performance data quoted represents past performance. Past performance does not guarantee future results. The investment return and principal value of an investment will fluctuate so that an investor’s shares, when sold or redeemed, may be worth more or less than their original cost and current performance may be lower or higher than the performance quoted. Performance current to the most recent month-end can be obtained by calling (833) 417-0090. The gross expense ratio for the fund is 1.09%.
View LBAY standardized performance here.
The Fund’s NAV is the sum of all its assets less any liabilities, divided by the number of shares outstanding. The market price is the most recent price at which the Fund was traded.
Asset prices rose everywhere during April. Unless the only thing you held was Bitcoin, or if you were a counterparty to Archegos Capital, it is most likely your portfolio was up during the month. Here is a broad sampling of returns for the month of April3:
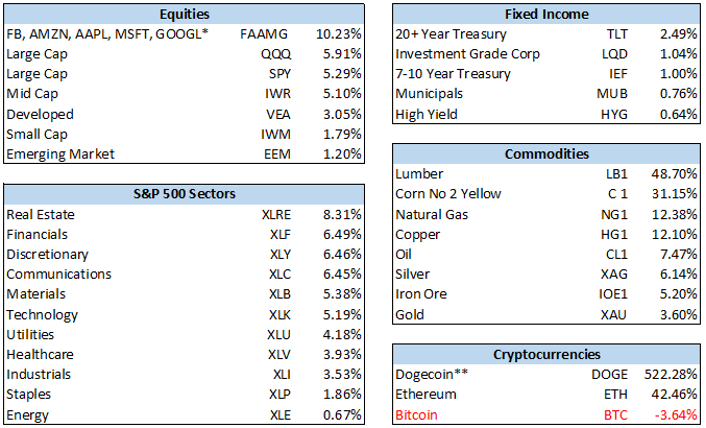
We have liftoff! The year 2021 has witnessed sharp moves higher in the commodity and materials complex, with increased costs of many widely used raw materials. The prices of raw materials needed to make just about anything are skyrocketing. Depending on who you ask, the reason for this could be the Federal Reserve printing money and driving asset prices higher, helicopter payments to consumers causing soaring personal income levels facilitating demand pull-forward, or the catch-all statement “it’s COVID-related”.
“If you see lumber and not apples, you probably need to step away from your Bloomberg screen” – Peter Atwater @Peter_Atwater |
Do the economic data points suggest these price changes are going to be passed along to the consumer, and for the longer term? This is still unclear. We ask you to peruse your recent grocery bill, the changed number of items or the volume in a packaged good, the updated cost of the new home you were going to build, or the revised estimate for that remodel you were contemplating last year and are now getting around to finalizing. Semiconductor chips and lumber anyone? Yes, everything seems to be going higher.
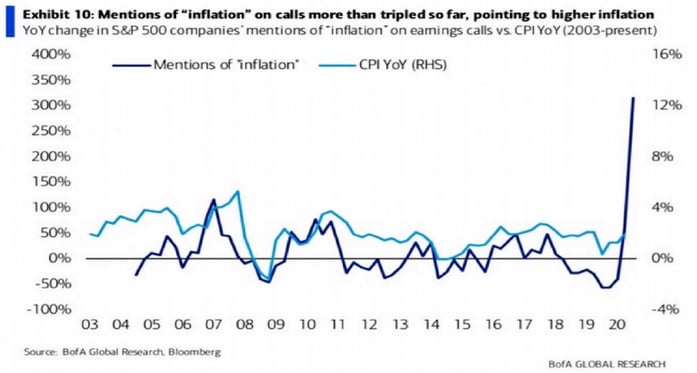
As a result of input price increases, we have started hearing a theme this quarter on earnings calls: Inflationary pressures on the raw material input mix used to produce final goods are impacting results.
We have been long several names we think are set up to benefit, rather than suffer, from this phenomenon. Bunge Ltd (BG) and Exxon Mobil Corp (XOM) remain two of our largest long positions due to their positive operating leverage to higher soft commodity and oil prices.
The Federal Reserve continues to say there is nothing to see here, but nominal yields and implied inflation breakevens have climbed since bottoming last year. During the last week of April, the first quarter GDP quarter over quarter price index came in higher than estimated. All of this is taking place in front of the backdrop of historic “stimulus” spending, on the order of trillions of dollars with more on the horizon and new programs being proposed at a steady rate. The issuance of Treasury securities that will be required to fund these initiatives is unprecedented.
As a counter-weight, at the same time the Fed is an active purchaser in open market operations and has indicated a willingness to stick around as a significant taker of supply. We can look at the trajectory of Federal debt and compare it to the total face Value of U.S. Treasury securities held by the Federal Reserve4 :
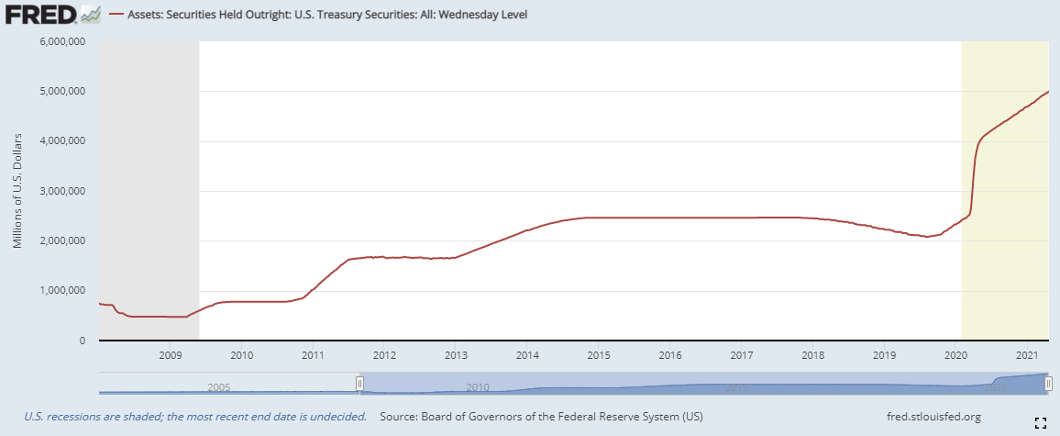
And then ask: How will this end?
Learn more about Leatherback ETFs
 |
