
The Leatherback Long/Short Alternative Yield ETF (LBAY) (the “Fund”) net asset value (NAV) increased by 0.73% in the third quarter of 2026, compared to 2.30% for the S&P 500 Index. LBAY paid our 70th consecutive monthly distribution, at $0.085 per share in September. This is a 2.98% SEC yield versus the S&P 500 Index dividend yield of approximately 1.06%. Year-to-date, the net asset value of LBAY has increased by 5.43%, compared to an increase of 12.75% for the S&P 500. The Fund’s correlation to the S&P 500 is -0.16 as of 9/30/2026.

The performance data quoted represents past performance. Past performance does not guarantee future results. The investment return and principal value of an investment will fluctuate so that an investor’s shares, when sold or redeemed, may be worth more or less than their original cost and current performance may be lower or higher than the performance quoted. Performance current to the most recent month-end can be obtained by calling (833) 417-0090. The gross expense ratio for the fund is 1.27%.
View LBAY standardized performance here.
The Fund’s NAV is the sum of all its assets less any liabilities, divided by the number of shares outstanding. The market price is the most recent price at which the Fund was traded.
*The S&P 500 Index includes 500 leading companies and covers approximately 80% of the available market capitalization. The S&P 500 Dividend Yield is the estimated sum of all dividends paid by the index’s stocks in the last 12 months, divided by the index market capitalization as reported by the S&P. The dividend yield does not represent or predict the performance of the Fund. Indexes are unmanaged and it is not possible to invest in an index. The 30-day SEC yield is calculated with a standardized formula mandated by the SEC. The formula is based on maximum offering price per share and does not reflect waivers in effect. The 30-day SEC yield is calculated from the 30 days ending on the last day of the previous month. This figure reflects income less expenses and approximates the yield an investor would receive in a 12-month period if a fund continues earning the same rate for the rest of the year. View the 30-day SEC yield here. The US Treasury yield reflects the interest rate the US government could expect to pay to borrow money for different periods of time.
Running on Narrow Legs with Weak Breadth
Equities rose narrowly during the third quarter, driven by a handful of Mega cap tech names. While geopolitical tensions and macro headwinds intensified, economic growth and corporate earnings appeared resilient. Dispersion was wide among U.S. stocks as large-caps finished higher, while mid- and small caps fell sharply. Despite the S&P 500 trading near all-time highs, only four of eleven sectors posted gains during the quarter. Interest rate-sensitive areas of the market faced heavy pressure. The 10-year Treasury yield rose approximately 85 basis points and topped 5% for the first time in nearly 20 years after the Fed hiked its benchmark interest rate in September. This led to a broader factor rotation in stocks as the MSCI USA Momentum Index returned -8.58% for the third quarter after a dominant first half of the year1.
September threw investors a curve ball with a month of abrupt leadership reversals amid even weaker breadth. Technology was the only sector to post positive returns2, while momentum and high-beta led among factors for the month3.
“The Ratio of Technology Stocks to the S&P500 Has Never Been Higher”
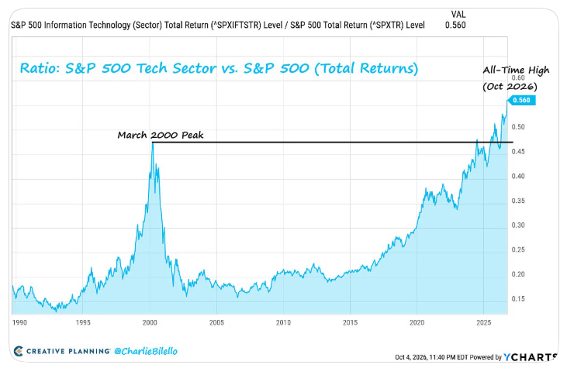
Source: Charlie Bilello https://x.com/charliebilello/status/2106955914603614235
Technology and AI are now carrying the market and the economy. Goldman Sachs Global Investment Research estimates that 10 companies accounted for 68% of all S&P 500 earnings growth in the third quarter, with Nvidia and Micron contributing over one-third.4
"I teach the history of financial-market fraud, but as part of it, we teach financial cycles because the fraud cycle follows the financial cycle, usually with a lag. And Paul (Kedrosky) made a wonderful point … that major booms are either credit-related, government-related, technology-related, or real-estate-related. He said this is the first one in a long, long time, if not ever … I think railroads might have been the other one where all four boxes are checked. It’s government policy. It’s certainly technology. It’s certainly credit-driven now. And it’s real-estate-related with the buildout of data centers. And so you’ve got four giant drivers for this cycle that all need to be harnessed and going in the right direction, and that increases the financial risk that we’ve been talking about.” —Jim Chanos, quoted in Fireside Alpha (@firesidealpha), X post5
“The AI Investment Boom is Reaching Unprecedented Levels”
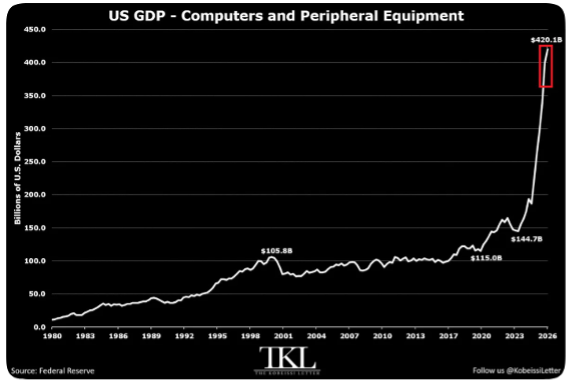
As of October 5, 2026 (Source: Kobeissi Letter https://x.com/KobeissiLetter/status/2107230958546305084)
Positioning Highlights
Energy sector holdings were top contributors for the quarter as tensions reignited in the Iran conflict and drove oil prices higher. Phillips 66 (PSX) was LBAY’s overall top performing individual position for the third quarter. In August, we decided to take profits and exit at a healthy gain. Phillips 66 had added significantly to the portfolio’s performance for the year, and we felt our thesis had largely played out. Considering the stock’s recent price appreciation and stabilizing oil prices, we believed further upside was limited. Exxon Mobil (XOM) also notably contributed to LBAY’s third quarter performance as its shares also rallied on higher oil prices and elevated refining margins. We maintain our long position in Exxon, which has, historically speaking, returned capital to its shareholders through buybacks and dividend increases.
Our mining industry holdings were another source of strength despite a bumpy ride through the quarter due to volatile metals trading. After mining stocks broadly pulled back in July, we took the opportunity to selectively add to our positions. The group rallied strongly in August as rising 30-year yields signaled higher inflation, but they abruptly sold-off after the Fed’s September rate hike slammed gold from its highs. Our positions in Newmont (NEM), Hecla Mining (HL), Barrick Mining (B), and Alamos Gold (AGI) were among LBAY’s top performers for the quarter.
On the Short Side
Our short position in AppLovin (APP) was a significant individual contributor in the third quarter, while Cava Group (CAVA) and Western Digital (WDC) shorts also helped. Detractors in the short portfolio included Meta Platforms (META) and Palantir Technologies (PLTR). We covered our short exposure to cryptocurrency-related businesses prior to August’s Bitcoin rally, closing positions in Strategy (MSTR), Robinhood Markets (HOOD), and Bitmine Immersion Technologies (BMNR). In addition to some of the expensive, lower-quality technology names in the short book, we also remain skeptical of private credit, expressed in our KKR & Co. (KKR), Carlyle Group (CG), and Appollo Global Management (APO) positions.
Individual Contributor
Becton, Dickinson and Company (BDX). Following its spin-off and Reverse Morris Trust transaction with Waters Corporation in February 2026, BDX is now a pure-play medical technology company spanning vascular access and blood collection devices, patient monitoring, drug delivery systems, and interventional solutions. The stock rallied 13.6% in August and traded near a 12-month high as investor sentiment was lifted by a strong quarterly earnings report which beat expectations for earnings per share and revenue. Our thesis that the new BDX is a more focused MedTech company has shown strong early momentum. We remain long BDX, but we did trim the position as it re-rated significantly higher in August.
Individual Detractor
Amrize (AMRZ). Shares of the construction materials supplier slid during the quarter after its second quarter results missed earnings expectations despite beating on revenue. Management cited cost inflation pressures due to elevated oil prices, while tariffs presented additional headwinds for the company’s Canadian business. In its report, Amrize announced that $502 million was returned to shareholders through buybacks and dividends in the second quarter.6
Notable Buy
Essential Utilities (WTRG). We added to our Essential Utilities position, bringing it to a top portfolio holding. The company is in the process of being acquired in an all-stock deal by American Water Works (AWK), the largest water utility in the U.S. The deal is expected to close in early 2027. In the meantime, Essential Utilities stock carries a 3.6% dividend yield and trades at a slight discount to the deal price. We expect to maintain a long position in AWK after the deal closes.
Notable Sells (short)
Vertiv (VRT). Early in the quarter, we initiated a timely short position in the data center infrastructure and services company as we did not believe its valuation was sustainable. The stock sold-off late in July as investors broadly rotated out of momentum AI stocks, and Vertiv missed revenue expectations in its quarterly results. After a brief bounce, the stock continued to move lower through August and September.
We broadly reduced our consumer exposure by initiating short positions in SharkNinja (SN) and CAVA Group (CAVA). We also continue to maintain a short position in Life Time Group (LTH).
Looking Ahead
We remain constructive on the investment opportunities emerging in this environment. Our focus continues to lean toward tangible businesses and hard‑asset exposures, where we think underlying value is clearer. We also see attractive special situation opportunities where we believe the market has mispriced deal dynamics or under-appreciates embedded value.
At the same time, we are mindful of the distortions created by the long run in momentum. That leadership has begun to show cracks as AI‑related financing receives more disciplined scrutiny and interest rates have risen. We are cautious of the excesses that have built up, particularly given how much recent GDP growth has been driven by AI investment and asset‑price appreciation. History suggests that volatility often rises ahead of midterm elections, and we are carefully managing risk while seeking opportunities to buy quality companies with shareholder-friendly management teams at reasonable prices.