The Leatherback Long/Short Alternative Yield ETF (LBAY) (the “Fund”) net asset value (NAV) increased by 5.79% in January, compared to an advance of 1.44% for the S&P 500 Index. LBAY paid our sixty-third consecutive monthly distribution, at $0.085 per share in February. This is a 2.82% SEC yield versus the S&P 500 Index dividend yield of approximately 1.16%, and the 10-Year US Treasury yield of 4.044%*. NAV performance for the Fund to date since inception (November 16, 2020) has produced a 51.88% cumulative total return and an 8.35% annualized total return.

The performance data quoted represents past performance. Past performance does not guarantee future results. The investment return and principal value of an investment will fluctuate so that an investor’s shares, when sold or redeemed, may be worth more or less than their original cost and current performance may be lower or higher than the performance quoted. Performance current to the most recent month-end can be obtained by calling (833) 417-0090. The gross expense ratio for the fund is 1.27%.
View LBAY standardized performance here.
The Fund’s NAV is the sum of all its assets less any liabilities, divided by the number of shares outstanding. The market price is the most recent price at which the Fund was traded.
*The S&P 500 Index includes 500 leading companies and covers approximately 80% of the available market capitalization. The S&P 500 Dividend Yield is the estimated sum of all dividends paid by the index’s stocks in the last 12 months, divided by the index market capitalization as reported by the S&P. The dividend yield does not represent or predict the performance of the Fund. Indexes are unmanaged and it is not possible to invest in an index. The 30-day SEC yield is calculated with a standardized formula mandated by the SEC. The formula is based on maximum offering price per share and does not reflect waivers in effect. The 30-day SEC yield is calculated from the 30 days ending on the last day of the previous month. This figure reflects income less expenses and approximates the yield an investor would receive in a 12-month period if a fund continues earning the same rate for the rest of the year. View the 30-day SEC yield here. The US Treasury yield reflects the interest rate the US government could expect to pay to borrow money for different periods of time.
THREE-YEAR AI MARKET DOMINANCE ENDS!?
Beginning in late 2022, fervent investor optimism surrounding an artificial intelligence revolution sparked a stock market rally after OpenAI released ChatGPT on November 30, 2022.4 What subsequently followed was three consecutive years of positive returns, with the S&P 500 increasing 86.01% and the NASDAQ rallying 127.24% during the three-year period ending in 2025.5 During that time, the Magnificent Seven stocks (Mag 7) were responsible for more than half the rise in the S&P 500.6,7 According to JP Morgan Asset Management, “AI-related stocks have accounted for 75% of S&P 500 returns, 80% of earnings growth and 90% of capital spending growth since ChatGPT launched in November 2022.” 8
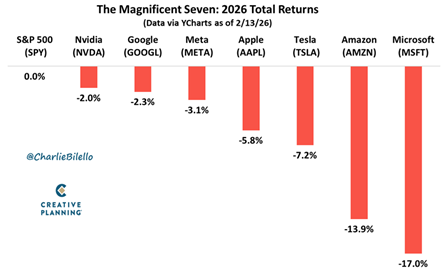
To begin 2026, US equity markets continued their ascent as the S&P 500 rose 1.44% in January, and the NASDAQ increased 0.97%. Yet, beneath the surface stock price action has shifted. Many technology companies have declined significantly as the AI chapter flips from a bullish to bearish narrative. Software stocks have been the hardest hit with the S&P North American Technology Software index9 down 35% from its September 2025 record high through February 23, 2026.10 In our opinion, recent stock price action portends an entirely new investment environment that could reward fundamentally focused active managers as many sectors and industries appear mispriced. We believe it may be an ideal time for investors to consider allocating to true long/short strategies. In our opinion, the shorting environment has not been this fertile since the beginning of 2022.
MAG 7 FREE CASH FLOW EVAPORATES
For the last several years, the allure of the Mag 7 stocks was the substantial cash flow generated by the companies. That cash flow was prudently deployed to share buybacks, which supported valuations and returned capital to shareholders. However, in our opinion, the playbook has dramatically changed. The Mag 7 companies are now redirecting capital away from shareholder returns and toward massive capital expenditure as these companies pursue ambitious AI infrastructure spending plans.
“When I looked at the numbers, one of the things that caught my eye immediately was… GOOGL is increasing their capex estimates for 2026 by $60B, 2027 estimates for operating income and net income barely budged. So is that good or bad? It means that your return on invested capital is dropping.” – Jim Chanos11
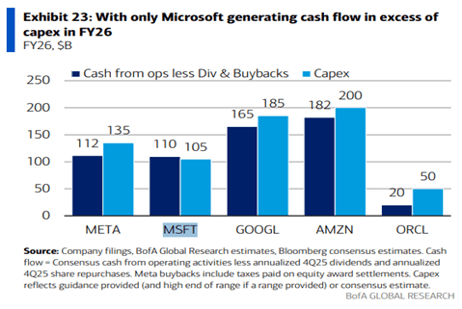
More concerning to us is that many of these companies are now tapping debt markets to fund their AI capex initiatives. According to UBS, technology sector debt issuance will reach $1 trillion in 2026.12 Notably, the Mag 7 have collectively guided that they intend to spend $680 billion in 2026.13
“The biggest driver of the economy seems to be the frothy stock market, which has seen a capex cycle, driven by AI. We are seeing signs of extreme late-cycle behavior, for example, in the debt financing of data centers. More than 60% of data centers are being built outside of hyperscalers with heavy debt usage, far greater than in the dot-com era. Equity valuations are extremely high. In our view, you aren’t getting paid to take risks. And that is without discussing geopolitics.” – Rajiv Jain14
INTEREST RATE CUTS MIGHT NOT BE ENOUGH
In our opinion, the parallels to previous market excesses have become difficult to ignore. Market concentration, valuation extremes, debt levels, and speculative behavior all point to what we think could be late-cycle dynamics. Market participants appear hopeful that the new incoming Federal Reserve Chairman Kevin Warsh will cut interest rates in 2026 which will provide cover to remain long risk assets.
“I’m constructive because of the [interest rate] easing right now, but I’m also miserable because of the levels… one easing or two easings or even three easings don’t matter.” – David Tepper15
Given the concentration of the Mag 7 across market indices, we think it may be prudent for investors to consider looking elsewhere. The year 2026 provides an opportunity to diversify away from Mag 7 and AI themes.
“A lot of people get rich in the stock market for the time being. It doesn’t change the laws of nature. The higher the market the lower the returns will be. I think the probabilities that AI will not bust are slim to none. It meets every condition from the railroads and the internet. It’s a powerful idea that’s attracted everyone’s money. No one has any doubts. They had no doubts about the railroads and the internet. Why would they, they were brilliant ideas.” – Jeremy Grantham16
PORTFOLIO REVIEW17**
PRECIOUS METALS
On the long side of the book, we continue to maintain meaningful long positions in precious metal mining companies, including Newmont Mining (NEM), Hecla Mining Company (HL) and Alamos Gold Inc (AGI).
“Gold is obviously going up because as the great Jim Grant put it in a recent podcast the price of gold is the reciprocal of the investors’ confidence in central bankers. It’s clear that people are losing confidence in central bankers given their deficit spending and the value of the dollar has been coming into question as it’s been falling. I think it’s pretty clear gold is going higher. It’s going up for a reason.” – Jeffrey Gundlach18
NEM is one of the largest gold miners by market capitalization and the only pure gold miner in the S&P 500 Index. NEM performed exceptionally well as it appreciated by over 172% on a total return basis in 2025 and is up considerably in early 2026. We believe NEM can continue to thrive as gold prices are seeming to trend higher for the foreseeable future.
In late 2025 we initiated positions in Canadian-based gold producer Alamos Gold Inc (AGI) and Hecla Mining Company (HL), which is the largest primary silver producer in the United States and Canada. We view both as having high quality mining assets with strong balance sheets and proven management teams. We added to both positions on recent weakness at the end of January 2026.
HONEYWELL: VALUE CREATION THROUGH TRANSFORMATION
We recently added to our long position in Honeywell International Inc (HON), the $155B market cap conglomerate industrials company. HON is undergoing a major structural transformation as the company is breaking up into three standalone businesses: aerospace, automation and advanced materials. The first tax-free spinoff of the advanced materials business, now trading under the ticker Solstice (SOLS), was completed in October of 2025. The aerospace division is expected to be spun off in the second half of 2026, and the RemainCo will be the automation business.
Additionally, we believe HON may benefit from its recently announced plan to IPO shares of Honeywell Quantinuum, a majority-owned HON business that develops quantum computing technologies. We think there is material upside for HON shareholders as the transformation is executed and HON becomes a much more focused company. In our opinion, the market is not fully appreciating the value that could be unlocked through these corporate actions.
We are attracted to HON’s defensive characteristics, strong free cash flow generation, and the catalyst-rich setup over the next 12-18 months. Presently, HON trades at what we believe is a significant discount to the sum-of-the-parts valuation of the three standalone businesses. We expect this discount to narrow as the spinoffs are completed and investors can more clearly value each business independently.
AFFIRM
We maintain a short position in Affirm Holdings (AFRM). AFRM, which became a public company in 2021, is a $16B market cap consumer finance company that originates “Buy Now, Pay Later” (BNPL) loans primarily to subprime consumers. Given President Trump’s administration focus on high-interest consumer credit and affordability, we think AFRM’s business model deserves heightened scrutiny.
AFRM boasts that it has over 24 million active consumers and a gross merchandise value of over $40B over the last twelve months. According to AFRM’s reporting, the average AFRM BNPL borrower maintains a 649 FICO score with roughly 63% of borrowers classified as either a millennial or Gen Z. A review of AFRM’s financials shows that interest income comprises roughly half of AFRM’s revenue with the average yield on the company’s outstanding loans approaching 31%, which is higher than most credit cards.
Notably, 96% of AFRM’s active users are classified as repeat customers. We find this statistic important as it suggests the growth is not from new consumers entering the platform, but rather existing consumers rolling into new debt. While investors seem to salivate over the fintech company’s growth in gross merchandise value and revenues, we are considerably less bullish on the company’s long-term prospects as we are concerned with the quality and sustainability of this growth.
In our opinion, AFRM has an unproven business model that has benefited from a US economy that has been at full employment during an inflationary period. AFRM presently trades for over 5x EV/Sales and over 16x gross profit. We believe the economic tailwinds may not persist, and we think a consumer spending slowdown or increase in default rates could materially impact AFRM’s business model. We view AFRM as a highly compelling short at today’s levels.
RIGETTI: QUANTUM HYPE MEETS FINANCIAL REALITY
We are short the stock of Rigetti Computing Inc (RGTI). RGTI went public via SPAC in March 2022 through a merger with Supernova Partners Acquisition Company II and began trading on the NASDAQ under the ticker RGTI. At the time of the merger RGTI was valued at $1.5B. Today, RGTI is an $6B market cap quantum computing company that generated just $7.5 million in total revenues and $355 million in total losses in the trailing twelve months ending September 2025. Since listing on the NASDAQ, the company’s shares outstanding have ballooned from 100 million in 2022 to 330 million shares at the end of September 2025, representing massive dilution to early shareholders. According to the company’s investor presentation, RGTI’s mission is to build the most powerful computers to solve humanity’s most important and pressing problems, and its strategy is to be at the forefront of superconducting quantum computing.
The big question in our mind is: will it ever generate any meaningful revenues or profit? There are presently thirteen sell-side analysts that cover the company, with ten of them rating the shares with an overweight or buy rating. In our opinion, there is little doubt these sell-side research firms would like to help RGTI issue more shares to generate banking fees. The sell-side consensus has RGTI forecasted to generate $21 million in total revenues in 2026, which would value the company at over 200x forward sales. In our opinion, RGTI has benefited enormously from investor hype surrounding quantum computing and AI themes. We think the valuation is completely disconnected from any reasonable assessment of the company’s near-term revenue or profit potential. We believe shares could decline meaningfully this year and view RGTI as a compelling short.
View LBAY top 10 holdings here. Holdings are subject to change. Characteristics and metrics of the companies shown are for the underlying securities in the fund’s portfolio and do not represent or predict the performance of the fund. There is no guarantee that a company will pay or continually increase its dividend.
FINAL THOUGHTS
We hope our investor partners enjoy our perspectives. We are finding many compelling ideas both long and short and we look forward to continuing our dialogue in the weeks and months ahead.
