The Leatherback Long/Short Alternative Yield ETF (LBAY) (the “Fund”) net asset value (NAV) advanced by 0.62% in April, compared to an advance of 1.56% for the S&P 500 Index. LBAY paid its twenty-ninth consecutive monthly distribution, at $0.075 per share in April. This is a 2.60% SEC yield versus the S&P 500 Index dividend yield of approximately 1.66%, and the 10-Year US Treasury yield of 3.425%. Year to date as of April 30, 2023, NAV for the Fund has declined 5.67%, compared to an advance of 9.17% for the S&P 500 Index. NAV performance for the Fund to date since inception (November 16, 2020) has produced a 47.46% cumulative total return and a 17.16% annualized total return.
The performance data quoted represents past performance. Past performance does not guarantee future results. The investment return and principal value of an investment will fluctuate so that an investor’s shares, when sold or redeemed, may be worth more or less than their original cost and current performance may be lower or higher than the performance quoted. Performance current to the most recent month-end can be obtained by calling (833) 417-0090. The gross expense ratio for the fund is 1.32%.
View LBAY standardized performance here.
The Fund’s NAV is the sum of all its assets less any liabilities, divided by the number of shares outstanding. The market price is the most recent price at which the Fund was traded.
FACTOR FLIPS
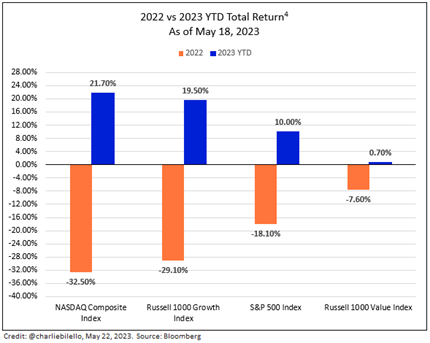
The year 2023 is proving to be the opposite of 2022. Last year, the NASDAQ Composite Index and large cap growth stocks performed poorly with the NASDAQ and Russell 1000 Growth Indices falling 32% and 29% in 2022. Year to date in 2023, the NASDAQ and large cap growth have far outperformed with the NASDAQ rising nearly 22% through mid-May and the Russell 1000 Growth rising almost 20%. In fact, since the lows printed for each of the indexes during the third quarter of 2022, both have risen over 24%3. Many theories abound as to why we are seeing the “V-shape” recovery in growth stock performance, but we believe that the market sentiment surrounding federal funds interest rate cut expectations has driven the buying frenzy. While the optics of the market’s resilience have been impressive, we note that an outsized portion of the returns have been driven by a handful of companies. We hypothesize that market participants have been caught off guard and the “fear of missing out” has caused momentum in too few names.
Factors that worked during 2022 have flipped during 2023. As we write this piece, we point out that buyback, dividend yield, profitability, quality, and value factors are negative, while growth has been off to the races this year3. In our opinion, the remainder of 2023 may be much different than the first several months, and long-short strategies should be a core part of allocator portfolios. Why do we think this? In the recent earnings cycle, we have seen a pick-up in companies acknowledging potential cracks in growth forecasts. One of the largest retail bellwethers recognized potential stresses on the consumer, and two major home improvement centers are seeing softer demand as the result of dips in discretionary spending.
NO HIGH FIVES FOR CONSUMERS
The US Federal Reserve Board (the Fed) has set the lower bound of the target rate range to the magical 5% number. This may sometimes be thought of as a psychological level for investors lending their cash at a perceived “attractive” rate. Many financial conversations and media pieces in the current environment are pondering the lure of placing cash into higher yielding money market instruments.
"How many millionaires do you know who have become wealthy by investing in savings accounts? I rest my case." - Robert G. Allen
It has been a while, and maybe the first time for many, where cash savings can earn a rate of return rather than being a potential cost. This coin has two sides, however, as what savers may observe as a boon, borrowers are likely viewing as a hindrance. Market participants ponder if 5% is the finish line for the Fed rate hiking cycle, but more importantly to us is what level of pain are borrowers willing to bear?
We refer to the Federal Reserve Statistical Release5 for the Fourth Quarter of 2022 and are impressed at the level of household debt. We wonder what the result will be for a consumer that reveals themselves to have taken on the highest levels of borrowing since data points going back to 1988. The annual growth rate of consumer credit in 2022 approached 8%, which is a level unseen since 2001. The annual rate of one-to-four family mortgages grew by over 7%, albeit slightly slower than in 2021. Annual growth in mortgage debt hasn’t been above a 7-handle since 2007, or before the previous housing market disaster. The trend in seasonally adjusted annual rates for each quarter in both categories during 2022 has been down, with mortgage debt growth slowing more than credit. The bottom line for us is that consumer credit was still in growing mode when rounding out 2022.
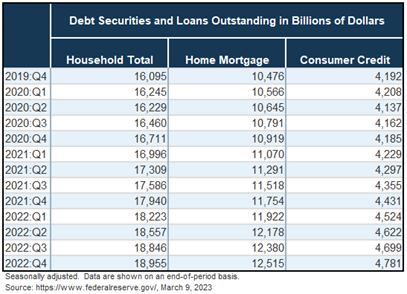
$19 Trillion! This was the level of household debt outstanding to end the fourth quarter. $12.5 Trillion of this was in mortgages, while almost $4.8 Trillion was in the form of consumer credit. Take these staggering numbers and pair them with interest rates that have risen further since then but may not yet have arrived at the terminal rate. Could this combination prove to be, as the Chair of the Fed posits: “sufficiently restrictive” to the Consumer?
“…we’ve been raising interest rates, and that raises the price of credit, and that, in a sense, restricts credit in the economy,
working through the price mechanism.” - Jerome Powell
PORTFOLIO REVIEW6
After a total return of over 22% in 2022, the performance of our Fund has struggled to start 2023. Notably, the short positions that worked so well for us in 2022 have been detractors in 2023. While we did not expect the rally in our short positions, we believe this underperformance will be temporary and is more factor-driven than idiosyncratic. We continue to maintain short positions in consumer discretionary names as we believe the US Consumer is rolling over. We also believe the names that have narrowly led the market in 2023 maintain the most risk for capitulation. We have a negative bias to high sales growth and unprofitable story stocks; names that despite their sales growth, continue to hemorrhage cash.
On the long side of the ledger, we maintain exposure to companies in the healthcare sector as we think healthcare will perform well if we enter a recessionary environment. We are long AbbVie Inc. (ABBV), GE Healthcare Technologies Inc (GEHC), Johnson & Johnson (JNJ), Medtronic, PLC (MDT), and Zimmer Biomet Holdings, Inc. (ZBH).
View LBAY top 10 holdings here. Holdings are subject to change. Characteristics and metrics of the companies shown are for the underlying securities in the fund’s portfolio and do not represent or predict the performance of the fund. There is no guarantee that a company will pay or continually increase its dividend.
FINAL THOUGHTS
Since launching in November 2020, we believe our Fund has performed well. However, we have had multiple observation periods where we detracted. Notably, we have had three drawdowns near and over 10% on a total return basis. Having said this, we strive to measure our success over the longer term, as generating positive alpha* over long periods of time cannot occur in a straight line. We appreciate our investor partner’s support, and we look forward to continuing our dialogue in the weeks and months ahead.
