The Leatherback Long/Short Alternative Yield ETF (LBAY) (the “Fund”) net asset value (NAV) declined by 6.51% in June, compared to a decline of 8.25% for the S&P 500 Index. LBAY paid our nineteenth consecutive monthly distribution, at $0.065 per share in June. This is a 2.49% SEC yield versus the S&P 500 Index dividend yield of approximately 1.70%, and the 10-Year US Treasury yield of 3.016%. Year to date as of June 30, 2022, NAV for the Fund has returned 11.77%, compared to a decline of 19.96% for the S&P 500 Index. NAV performance for the Fund to date since inception (November 16, 2020) has produced a 42.76% cumulative total return and a 24.59% annualized total return.
The performance data quoted represents past performance. Past performance does not guarantee future results. The investment return and principal value of an investment will fluctuate so that an investor’s shares, when sold or redeemed, may be worth more or less than their original cost and current performance may be lower or higher than the performance quoted. Performance current to the most recent month-end can be obtained by calling (833) 417-0090. The gross expense ratio for the fund is 1.43%.
View LBAY standardized performance here.
The Fund’s NAV is the sum of all its assets less any liabilities, divided by the number of shares outstanding. The market price is the most recent price at which the Fund was traded.
ARE CORPORATE PROFIT MARGINS NEXT?
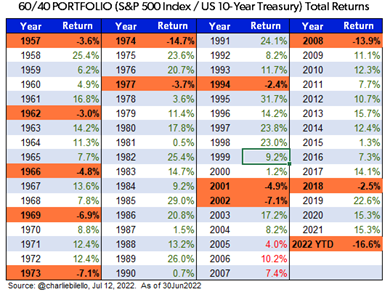
In years past, when financial assets declined significantly, market participants could confidently wade into the risk waters and begin to bid up asset prices knowing the US Federal Reserve Board (the Fed) could and would provide stimulus to ease market conditions – and, ultimately, drive up asset prices. Yet here we are in mid-2022, and the Fed is raising rates and removing stimulus as the market decline accelerates! Investors are facing slowing economic growth, higher inflation, rising interest rates and a strong US dollar. This powerful mix of headwinds portend to lower corporate profit margins in the second half of 2022 and beyond. In the first half of 2022, market multiples contracted; in our opinion, corporate profit margins are next. It’s clear to us that investors have become both cautious and concerned about the market outlook and for good reason - equity and bond markets are having some of their worst performance records to start off a year. US Treasuries, investment grade bonds and junk bonds are all nearly down double digits for the start of 2022 through the end of June. As shown below, the 60/40 model of equities and bonds is experiencing one if its worst performance years ever!
Interestingly, as companies have begun to report lackluster second quarter results, stocks have rallied through the first part of July – most likely because almost everything has been deeply oversold on a technical basis. While we are not surprised to see a rally, we think market prices will continue to be volatile as we enter the second half of the year. Notably, some of the poorest quality companies have had significant rallies over the past month, with the most heavily shorted names outperforming in recent weeks. We believe this will prove to be a temporary phenomenon and will provide new entry points for attractive short positions.
FED-INDUCED LIQUIDITY UNLIKELY TO RETURN
"I never use valuation to time the market. I use liquidity considerations and technical analysis for timing. Valuation only tells me how far the market can go once a catalyst enters the picture to change the market direction." – Stanley Druckenmiller
In our opinion, the market setup is very different than any that investors have experienced since the global financial crisis (2007-2009). We do not believe financial markets will be flooded with stimulus in the near or medium-term, which will provide headwinds for asset prices. We also think there is a strong likelihood that a higher plateau of interest rates has arrived and that any Fed interest rate cuts will take place further in the future than the market is currently discounting. Notably, over the last year or so as inflation has jumped around 7 percentage points, the Fed’s short-term interest rate target has only been lifted 1.5 points while the 10-year Treasury yield has risen nearly 1.9 points. The market reflects a disbelief that inflation will remain high. Market interest rates are pricing in a dramatic drop in inflation, which we think is unlikely.
"What seems to be forgotten here is that inflation is a sticky, slow moving variable, spikes can reverse quickly, but underlying inflation tends to move in a gradual lagged fashion with respect to the economy. It is going to take time to cool off the labor market and even more time to lower labor cost-driven inflation3." - Ethan Harris, Bank of America
We are of the opinion that while inflation may come down gradually, it’s unlikely to return to a 2% annualized inflation environment. The US economy has experienced both a demand shock as the Fed pumped trillions in stimulus into the economy, and a supply shock as the pandemic induced domestic supply constraints. Additionally, de-globalization trends and the conflict in Europe have complicated global trade which has exacerbated supply-side impacts.
“My dialogue with CEOs operating big global businesses, they tell me that they continue to see persistent inflation in their supply chains. Our economists meanwhile say there are signs that inflation will move lower in the second half of the year. The answer is uncertain and we will all be watching it very closely4.” - David Solomon, CEO of Goldman Sachs
We expect a prolonged environment of higher inflation and subsequent margin compression across corporate profits. The US consumer is in a very tough spot as their unrealized paper wealth in stocks, bonds and home equity are no longer appreciating, but in most cases are falling. The investors and speculators embracing cryptocurrencies and NFTs have also felt pain with many now questioning the validity of their counterparties.
PORTFOLIO UPDATE*5
During the first half of the year, we initiated a new long position in Hasbro Inc (HAS), which is close to a $15B enterprise value company that operates in consumer products (toys), digital gaming and entertainment. Notably, the toy industry has historically been recession resilient. Hasbro has many leading franchises that we expect to maintain pricing power in the present inflationary environment. We think HAS is likely to grow top-line faster than expenses resulting in profit growth exceeding revenue growth. Additionally, the company has an activist investor that has put capital allocation in the spotlight. The company has responded by paying $192 million in dividends, repurchasing $124 million in stock year-to-date, and is also on target to reduce leverage to 2 to 2.5x debt to adjusted EBITDA (earnings before interest, taxes, depreciation, and amortization) by 20236. The stock currently trades for just under a 16x forward price to earnings multiple and yields roughly 3.45%. We anticipate owning shares for the foreseeable future.
Next, the shorting environment in 2022 has been dynamic. Many unprofitable technology companies sold off dramatically during the first half of 2022. In recent weeks, there has been significant upside volatility in many names that performed abysmally during the first half of the year. We expect to be prudent in our short selection and anticipate being proactive in trading our short book. In terms of themes, we are growing skeptical of many publicly traded real estate investment trust (REIT) valuations; as interest rates rise, cap rates should follow which should cause contraction in net asset values and negatively impact stock prices. We recently initiated a short position in Prologis Inc (PLD), a large industrial REIT that has benefited from the growth of distribution facilities globally. As we traveled this summer through Florida and throughout the Midwest, we were struck by the amount of industrial speculative space under construction; all “built to (read Amazon) suit”. With over a $93B market capitalization, PLD happens to be one of the largest market caps in the REIT space, is the largest industrial REIT in the indices7, and sports a dividend yield of about 2.5%. PLD happens to be one of Amazon’s largest landlords and just announced an all-stock acquisition of peer Duke Realty Corp (DRE); PLD management, to their credit, recognized their equity currency is rich and is utilizing it to acquire a rival. Real estate has been one of the prime beneficiaries of the Fed easy money policies for over the last decade. We expect to maintain short exposure to REITs broadly and will be looking to add exposure as more opportunities percolate.
View LBAY top 10 holdings here. Holdings are subject to change. Characteristics and metrics of the companies shown are for the underlying securities in the fund’s portfolio and do not represent or predict the performance of the fund. There is no guarantee that a company will pay or continually increase its dividend.
FINAL THOUGHTS
We hope our investor partners have enjoyed our monthly perspectives. We are finding many compelling ideas both long and short and we look forward to continuing our dialogue in the weeks and months ahead. We think the current environment lends well to long/short strategies, and we are optimistic our portfolio generates alpha on both sides of the book throughout the remainder of the year.
