Monthly Commentary - Real Time

June 22, 2023

The Leatherback Long/Short Alternative Yield ETF (LBAY) (the “Fund”) net asset value (NAV) declined by 7.59% in May, compared to an advance of 0.43% for the S&P 500 Index. LBAY paid its thirtieth consecutive monthly distribution, at $0.075 per share in May. This is a 2.87% SEC yield versus the S&P 500 Index dividend yield of approximately 1.66%, and the 10-Year US Treasury yield of 3.646%. Year to date as of May 31, 2023, NAV for the Fund has declined 12.83%, compared to an advance of 9.65% for the S&P 500 Index. NAV performance for the Fund to date since inception (November 16, 2020) has produced a 36.27% cumulative total return and a 12.97% annualized total return.

The performance data quoted represents past performance. Past performance does not guarantee future results. The investment return and principal value of an investment will fluctuate so that an investor’s shares, when sold or redeemed, may be worth more or less than their original cost and current performance may be lower or higher than the performance quoted. Performance current to the most recent month-end can be obtained by calling (833) 417-0090. The gross expense ratio for the fund is 1.32%.

View LBAY standardized performance here.

The Fund’s NAV is the sum of all its assets less any liabilities, divided by the number of shares outstanding. The market price is the most recent price at which the Fund was traded.


REAL TIME

THE RATE TIGHTENING IS REAL

We find it noteworthy that nominal interest rates are finally above the inflation rate, and real rates are now positive. Until recently, we suppose savers and users of credit were better off spending cash since there was a cost to not doing so. In essence, if you were to sit on cash there would be a negative impact as inflation exceeded the rate you could earn on that cash. Put simply, it could be more expensive in real terms to NOT spend. We think this caused the now-possibly entrenched mindset that prices would remain high, therefore causing consumers and investors to deploy cash now believing it may be even more expensive in the future. So, what does this mean? We think these brought-forward expenditures and investments have been a major driver of lofty goods, services, and risk asset prices. In our opinion, the recent interest rate paradigm provided the incentive to spend now rather than later and has been conflated as growth.

This brings us to today, where we find recent inflation rates are now below shorter-term interest rates. For the first time in quite some time, there is an actual cost of funds. The preference and ability to consume or invest currently may now be switching to a preference for future consumption and investment given the resumption of a cost to doing so. We do not believe it takes much of a leap when pondering the impact of what could be described as insatiable appetites for levels of debt and worries of delinquency rate increases. Now consider these two characteristics with a backdrop of interest rates that may continue the march higher. We wonder, will the “growth” mentioned above begin to show unsustainability during the back half of 2023 and into the year 2024?


THEN AND NOW, NOW AND THEN

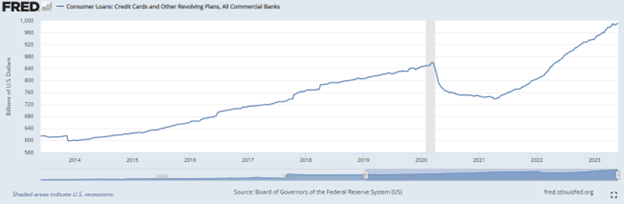
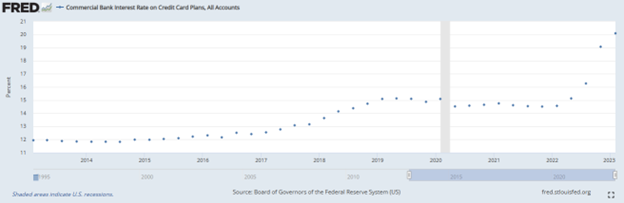
The below visuals show what we think summarize consumer budget impacts given the hardships of inflation. Over the past ten years you can see the spike in credit card balances that has taken place. It is then difficult to ignore the near-simultaneous increase in interest rates3. In our opinion, this is not a good recipe.

2023.05 CreditCardDebt

2023.05 CreditCardRates

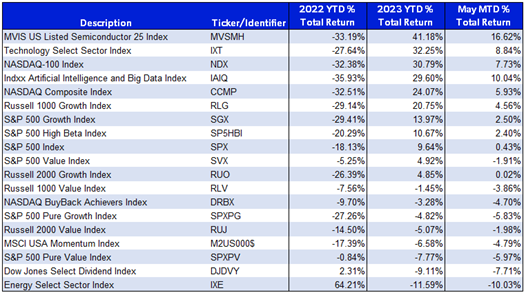
We leave you with one last chart showing what happened during 2022, this year to date, and during the month of May in equity markets4. We question whether this reflects a healthy market dynamic or is this basically a temporary revisiting of the pandemic market environment. Counterintuitively, as real rates have risen and debt levels continue their increase, long duration* equities have performed quite well. We think these two pain points of the true cost of funds will be felt and wonder how much longer the long duration equity rally may persist.

2023.05 Table

PORTFOLIO REVIEW5*

Our largest position continues to be Bunge Limited (BG), which maintains a $14B market capitalization and operates as a global agribusiness and food company; BG is a leading company in oilseed processing and supplier of specialty plant-based oils and fats. Notably, the company just announced its intention to acquire Viterra Limited, the global agribusiness of Glencore PLC in an $8B transaction that is a mix of cash and stock, and additionally will include the assumption of Viterra debt. We are very bullish on the deal as it transforms Bunge into a pure-play global agribusiness with highly complementary businesses and geographic footprints while diversifying BG’s footprint with increased grain handling and logistics assets. We are pleased to see that Glencore and key investors are retaining their ownership in the newly combined entity; also, credit rating agencies have placed the company’s credit profile under review for upgrade upon announcement of the deal. Additionally, the company will maintain its dividend per share and plans to execute a $2B stock buyback, equivalent to over 10% of the current market value as existing shareholders await the deal consummating. Pro forma with synergies, Bunge expects the combined entity to generate approximately $5.6B Adjusted EBITDA and roughly $3.2B in discretionary cash flow. We expect Bunge to be a core holding and for value to accrete higher over the medium term.

Next, we continue to be long medical device companies Zimmer Biomet Holdings, Inc. (ZBH) and Medtronic, PLC (MDT). We are pleased to see industry participants confirm the thesis we have maintained on the medical device space since coming out of COVID; our thesis was specifically that pent up demand was significant for the oligopolist replacement hip and knee industry, and medical devices generally, and these two companies would be beneficiaries.

“[Seniors are accessing services for] things that they might have pushed off a bit like knees and hips…We’re just seeing more services, which, again, we’re really happy to see that our seniors are accessing the care that they need.”6 - Tim Noel, CEO UnitedHealthcare Medicare & Retirement

One sector we maintain short exposure is in the real estate sector, with short positions in Equinix, Inc. (EQIX) and Prologis, Inc. (PLD).

"When we raise interest rates we think, and we usually are correct, that we're going to decimate the real estate market, both commercial and residential."7 – Alan Blinder, Former Federal Reserve Vice Chair

View LBAY top 10 holdings here. Holdings are subject to change. Characteristics and metrics of the companies shown are for the underlying securities in the fund’s portfolio and do not represent or predict the performance of the fund. There is no guarantee that a company will pay or continually increase its dividend.

FINAL THOUGHTS

We hope our investor partners enjoy our monthly perspectives. We are finding many compelling ideas both long and short and we look forward to continuing our dialogue in the weeks and months ahead.

"
I hope it's well known by now that the Fed has never got anything right since Paul Volcker. They have merely created an environment conducive to a chain-linked series of super bubbles that break with outrageously consequential, painful effects." – Jeremy Grantham

*Definitions: Duration measures a bond's or fixed income portfolio's price sensitivity to interest rate changes. EBITDA is a company’s earnings before interest, taxes, depreciation, and amortization. Cash flow is the net amount of cash generated by a company, with cash received as an inflow, and cash spent as an outflow.

1 The S&P 500 Index includes 500 leading companies and covers approximately 80% of the available market capitalization. The S&P 500 Dividend Yield is the estimated sum of all dividends paid by the index’s stocks in the last 12 months, divided by the index market capitalization as reported by the S&P. The dividend yield does not represent or predict the performance of the Fund. Indexes are unmanaged and it is not possible to invest in an index.

2 The 30-day SEC yield is calculated from the 30 days ending on the last day of the previous month. This figure approximates the yield an investor would receive in a year, assuming that each bond in the portfolio is held until maturity. View the 30 day SEC yield here.

3 Source: https://fred.stlouisfed.org/, June 15, 2023

4 View LBAY top 10 holdings here.  MVIS US Listed Semiconductor 25 Index covers the largest and most liquid companies listed in the US, which are active in the semiconductors sector. The index is reviewed semi-annually, modified float market capitalisation weighted, and the maximum component weight is 20%. The Technology Select Sector Index is a modified cap-weighted index. The index is intended to track the movements of companies that are components of the S&P 500 and are involved in the development or production of technology products. The index which serves as a benchmark for The Technology Select Sector SPDR FundXLK, was established with a value of 250 on June 30, 1998. Parent: SECTOR. The NASDAQ-100 Index is a modified capitalization-weighted index of the 100 largest and most active non-financial domestic and international issues listed on the NASDAQ. No security can have more than a 24% weighting. The Indxx Artificial Intelligence and Big Data Index is designed to track the performance of companies listed or incorporated in developed markets that are positioned to benefit from the development and utilization of Artificial Intelligence technology in their products and services, as well as companies that produce hardware used in Artificial Intelligence applied for the analysis of Big Data. The NASDAQ Composite Index is a broad-based capitalization-weighted index of stocks in all three NASDAQ tiers: Global Select, Global Market and Capital Market. The index was developed with a base level of 100 as of February 5, 1971. Russell 1000 Growth Index measures the performance of those Russell 1000 companies with higher price-to-book ratios and higher forecasted growth values. The index was developed with a base value of 200 as of August 31, 1992. The S&P 500 Growth Index is a market capitalization weighted index. All the stocks in the underlying parent index are allocated into value or growth. Stocks that do not have pure value or pure growth characteristics have their market caps distributed between the value & growth indices. Prior to 12/19/2005 this index represented the S&P 500/Barra Growth Index The S&P 500 High Beta Index measures the performance of 100 constituents in the S&P 500 that are most sensitive to changes in market returns. The S&P 500 Value Index is a market capitalization weighted index. All the stocks in the underlying parent index are allocated into value or growth. Stocks that do not have pure value or pure growth characteristics have their market caps distributed between the value & growth indices. Prior to 12/19/2005 this index represented the S&P 500/Barra Value Index Russell 2000 Growth Index measures the performance of those Russell 2000 companies with higher price-to-book ratios and higher forecasted growth values. Russell 1000 Value Index measures the performance of those Russell 1000 companies with lower price-to-book ratios and lower forecasted growth values. The index was developed with a base value of 200 as of August 31, 1992. NASDAQ BuyBack Achievers Index is a modified market capitalization weighted index designed to capture the performance of U.S. listed companies which have repurchased at least 5% of their outstanding shares for the trailing 12 months. S&P Pure Growth Indices includes only those components of the parent index that exhibit strong growth characteristics, and weights them by growth score. Russell 2000 Value Index measures the performance of those Russell 2000 companies with lower price-to-book ratios and lower forecasted growth values. The MSCI USA Momentum Index is based on MSCI USA Index, its parent index, which captures large and mid cap stocks of the US market. It is designed to reflect the performance of an equity momentum strategy by emphasizing stocks with high price momentum, while maintaining reasonably high trading liquidity, investment capacity and moderate index turnover. The S&P 500 Pure Value index is a style-concentrated index designed to track the performance of stocks that exhibit the strongest value characteristics by using a style-attractiveness-weighting scheme. The selection of stocks to the Dow Jones U.S. Select Dividend Index is based almost entirely on dividend yield and dividend history. Stocks are also required to have an annual average daily dollar trading volume of more than $1.5 million.These criteria help to ensure that the index represents the most widely traded of the market's highest-yielding stocks. This is a total return index. The Energy Select Sector Index is a modified capitalization-weighted index. The index is intended to track the movements of companies that are components of the S&P 500 and are involved in the development or production of energy products. The index which serves as the benchmark for The Energy Select Sector SPDR Fund XLE was established with a value of 250 on June 30, 1998. Parent index SECTOR. Indexes are unmanaged and it is not possible to invest in an index. Sources: Bloomberg, https://www.spglobal.com/, https://www.msci.com/

5 View LBAY top 10 holdings here. Holdings are subject to change. Characteristics and metrics of the companies shown are for the underlying securities in the fund’s portfolio and do not represent or predict the performance of the fund. There is no guarantee that a company will pay or continually increase its dividend. Section Sources: Bloomberg, https://investors.bunge.com/

6 Source: https://www.foxbusiness.com/, June 14, 2023

7 Source: @SquawkStreet, June 13, 2023

Jeremy Grantham quote source: https://markets.businessinsider.com/

Opinions expressed are subject to change at any time, are not guaranteed, and should not be considered investment advice.