The Leatherback Long/Short Alternative Yield ETF (LBAY) (the “Fund”) net asset value (NAV) advanced by 4.29% in March, compared to 3.71% for the S&P 500 Index. LBAY paid our sixteenth consecutive monthly distribution, at $0.065 per share in March. This is a 2.63% SEC yield versus the S&P 500 Index dividend yield of approximately 1.37%, and the 10-Year US Treasury yield of 2.341%. Year to date as of March 31, 2022, NAV for the Fund has returned 11.67%, compared to a decline of 4.60% for the S&P 500 Index. NAV performance for the Fund to date since inception (November 16, 2020) has produced a 42.64% cumulative total return and a 29.6% annualized total return.
The performance data quoted represents past performance. Past performance does not guarantee future results. The investment return and principal value of an investment will fluctuate so that an investor’s shares, when sold or redeemed, may be worth more or less than their original cost and current performance may be lower or higher than the performance quoted. Performance current to the most recent month-end can be obtained by calling (833) 417-0090. The gross expense ratio for the fund is 1.43%.
View LBAY standardized performance here.
The Fund’s NAV is the sum of all its assets less any liabilities, divided by the number of shares outstanding. The market price is the most recent price at which the Fund was traded.
IS THE 60/40 MODEL BROKEN?
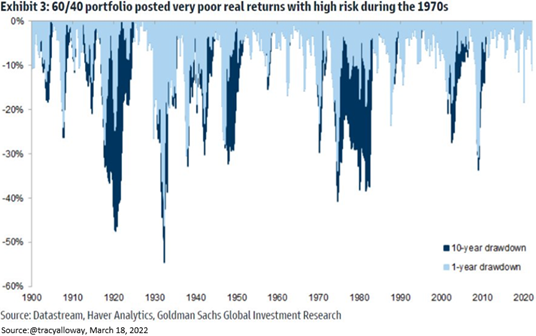
The year 2022 has been marching to a unique drumbeat as both equity and fixed income markets have declined in tandem year-to-date. Historically, many allocators have relied on the mix of 60% stocks and 40% bonds to generate stable capital appreciation and income to meet financial goals. This proved rewarding over the past 30 years or so as the strategy produced a roughly 8 to 9% annualized return3. Yet, during the first quarter of 2022 the 60/40 model declined more than 5%4. Meanwhile, inflation has been surging with the latest year-over-year consumer price index reading breaking out to over 8%. Investors are finding it challenging to achieve a positive real rate of return on investment in the present environment.
“When growth is slower than expected, stocks go down. When inflation is higher than expected, bonds go down. When inflation’s lower than expected, bonds go up” – Ray Dalio
We expect these conditions may persist for some time as inflation remains elevated, with bond markets deflating further as interest rates continue the grind higher. The historical inflation-adjusted performance of the 60/40 model is depicted below. Will the next several years look like the high inflation decade of the 1970s?
WE WERE INVERTED!
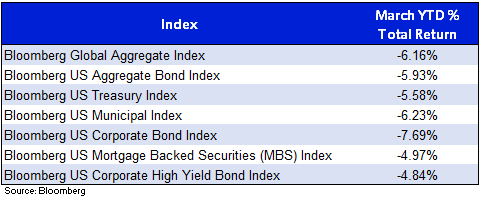
Quite notably, fixed income markets experienced one of the worst quarters in history, with the Bloomberg Global Aggregate Index falling over 6% during Q1 20225. Policymakers in the US continue to signal that US short-term interest rates need to rise, in front of a backdrop of unwanted inflation and uncertainty given the continuing conflict in Eastern Europe. The Federal Reserve recently increased the Fed Funds rate by 25 basis points*, and Fed members are being perceived to have a bit of panic in their voices. This is the first hike of the key rate since 2018, and the first since rates have been effectively zero. From global and US broad market indices, to state and local, corporate, mortgages, and high yield debt, there was seemingly no place for investors to find cover5.
While this is happening broadly, there are many market-watchers confidently saying the brief US Treasury yield curve inversion (shorter term interest rate levels that are lower than longer maturity levels) that we saw take shape will not precede an economic downturn.
“It’s tough to make predictions, especially about the future.” – Yogi Berra
While we are not taking one side of this argument or the other, we are acutely aware this is the same group that exclaimed inflation would have disappeared by now and the market for fossil fuels would crash. Neither the former, nor the latter, have materialized.
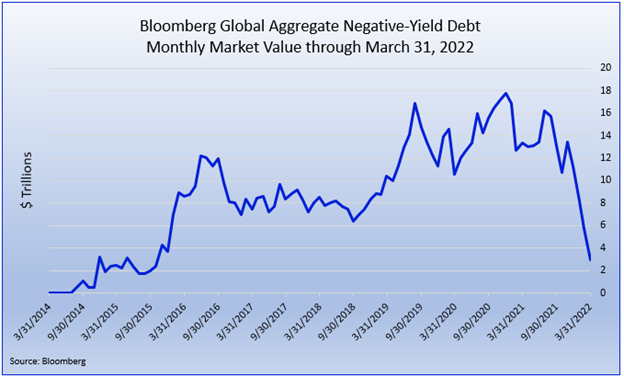
It is evident that the bond market is making its viewpoint known. The below visual is reflective of central bank policy shifts coupled with bond investors voting with their feet. The market value of negative-yielding debt globally has slid to below $3 Trillion after reaching $18 Trillion during the pandemic6. Maybe the negative interest rate experiment is approaching its conclusion?
COLLATERAL DAMAGE
Asset prices are reacting to market forces and price discovery is returning as liquidity is drained from the monetary system, and investors begin to be more thoughtful about what is backstopping securities. This is a healthy, albeit painful, reset for market participants.
“Earnings don't move the overall market; it's the Federal Reserve Board... focus on the central banks, and focus on the movement of liquidity... most people in the market are looking for earnings and conventional measures. It's liquidity that moves markets.” – Stanley Druckenmiller
As risk premiums are repriced, the initial public offering market has ground to a halt with just 24 companies raising a total of $2.4B thus far in the first quarter of 2022. This compares to 98 companies raising $42B in the comparable period of 20217.
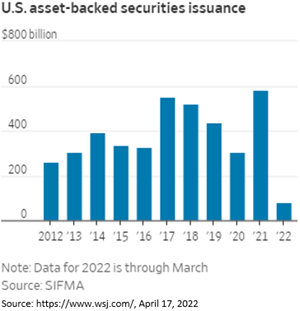
Additionally, we are seeing investors demand higher yields as the junk bond market and asset backed securities markets begin to pause debt sales as buyers have re-traced or taken a step back. Issuance of asset-backed securities in the US has declined 45% during the first quarter when compared to the start of 2021, and the visual below is somewhat telling of the shift in sentiment8:
The mortgage-backed market has witnessed lower marks and continues the pain trajectory as interest rates continue to rise and investors question the consumer and the ability to pay. The average interest rate on a 30-year loan reached 5% to end the second full week of April and hasn’t hit a level this high in over 10 years9! In our opinion, the equity market is next in the pecking order, and we expect a very volatile remainder of 2022.
PORTFOLIO UPDATE*10
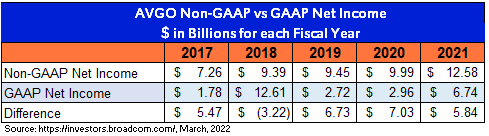
We are presently short Broadcom Inc. (AVGO), which maintains a $270B enterprise value (EV) with nearly $40B in gross debt, or $30B net debt when factoring in cash. The company generated $27.5B in revenue in 2021 and earnings per share of $15.00, resulting in an EV to Revenue multiple exceeding 9x and a Price to Earnings (P/E) multiple that approaches 40x. Broadcom operates in the semiconductor and infrastructure software solutions industries. In our opinion, AVGO also operates in the financial engineering space, as its balance sheet has grown from almost $0 in gross debt in 2013 to the approximately $40B seen today, and diluted weighted shares outstanding have grown from roughly 252 to 429 million over the same period. AVGO Non-GAAP Net Income has been rising steadily, while GAAP Net Income has been lumpy and lower than the 2018 high11:
AVGO is no stranger to investment banks, with 26 “outperform” or “buy” ratings on the stock. In its latest 10K filed on December 17, 2021, the word “acquisition” appeared 124 times in a word search. In AVGO’s business strategy section the company boasts that its “strategy is to combine best-of-breed technology leadership in semiconductor and infrastructure software solutions… through responsibly financed acquisitions of category-leading businesses and technologies…” Given Central Banks globally are tightening financial conditions paired with the resulting re-rate of risk we discussed earlier, we think it may be difficult for AVGO to continue its financial-engineering-led growth trajectory. We are also not bullish on semiconductors, which tend to do poorly in a recessionary and inflationary environment. We believe macro influences could prove to be an additional headwind to AVGO stock performance.
Next, we are long H&R Block, Inc. (HRB). HRB maintains a market capitalization of around $4.5B, trades for a P/E multiple of just over 9.4x 2022 estimated earnings and has a current dividend yield of nearly 4%. Based in Kansas City, MO, HRB offers assisted, do-it-yourself, and virtual tax preparation services across the US. We have been impressed with management led by CEO Jeff Jones. We view the legacy business as a nice growing cash annuity proposition, while we see an opportunity for HRB to grow in the small business channel. We also believe there is optionality in its Wave solutions enterprise. Over the last five plus years, the company has retired over 25% of its shares outstanding and increased its annual dividend payout by 35%. H&R Block, Inc. is presently a top position in our Fund.
FINAL THOUGHTS
Our Fund performed quite well posting positive performance in January, February, and March. Given what we have outlined in our discussion, we think the next decade will look different from the past 10 years. We are finding many compelling ideas both long and short and we look forward to continuing our dialogue in the weeks and months ahead.
