The Leatherback Long/Short Alternative Yield ETF (LBAY) (the “Fund”) net asset value (NAV) advanced by 5.17% in January, compared to a decline of 5.17% for the S&P 500 Index. LBAY paid our fourteenth consecutive monthly distribution, at $0.065 per share in January. This is a 3.16% SEC yield versus the S&P 500 Index dividend yield of approximately 1.34%, and the 10-Year US Treasury yield of 1.778%. NAV performance for the Fund to date since inception (November 16, 2020) has produced a 34.33% cumulative total return and a 27.67% annualized total return.
The performance data quoted represents past performance. Past performance does not guarantee future results. The investment return and principal value of an investment will fluctuate so that an investor’s shares, when sold or redeemed, may be worth more or less than their original cost and current performance may be lower or higher than the performance quoted. Performance current to the most recent month-end can be obtained by calling (833) 417-0090. The gross expense ratio for the fund is 1.43%.
View LBAY standardized performance here.
The Fund’s NAV is the sum of all its assets less any liabilities, divided by the number of shares outstanding. The market price is the most recent price at which the Fund was traded.
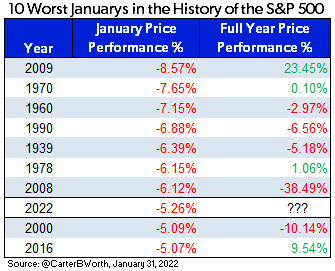
The month of January 2022 marks the worst start to a year for the S&P 500 since 2009, and the 8th worst in S&P 500’s history3. What happens in January does not necessarily portend a negative S&P 500 return year. But, if history is any guide, we think it is unlikely to be a robust performance year for investors.
We believe the sentiment shift taking place among market participants is welcome and healthy for asset markets in general. We believe the environment is very constructive for long/short portfolios, with alpha generation* to be had as security prices rise and fall as risk appetites broadly reset.
“The stock market is the story of cycles and of the human behavior that is responsible for overreactions in both directions.” – Seth Klarman
Just one year ago, WallStreetBets and Meme stocks dominated the market narrative. As we said in many conversations last year, the market action in stocks mentioned on Reddit or WallStreetBets reminded us of the streaker who jumped on the field during the football game; it’s not part of the game we came to watch, but how could you not look as it was happening!? Well, we think those that were rooting for the streaker have sobered. We think the “diamond hands” and “bag holders” are leaving a trove of opportunities both long and short.
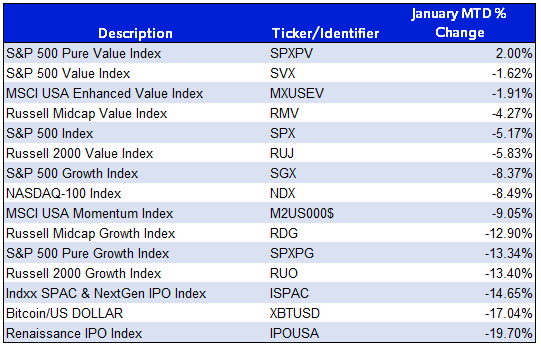
Meanwhile, value strategies have been significantly outperforming growth recently, although most value benchmarks declined in January – just not nearly as much as growth. Growth investors witnessed substantial declines across all capitalizations. Additionally, new issues in both the initial public offering (IPO) and special purpose acquisition company (SPAC) categories struggled, as did Bitcoin, as you can see in the below month-to-date total return table4.
In our opinion, this sentiment shift away from unprofitable growth stocks is unlikely to be transitory, and fundamental stock picking will be rewarded as Central Bank liquidity is drained.
CURVE BALL
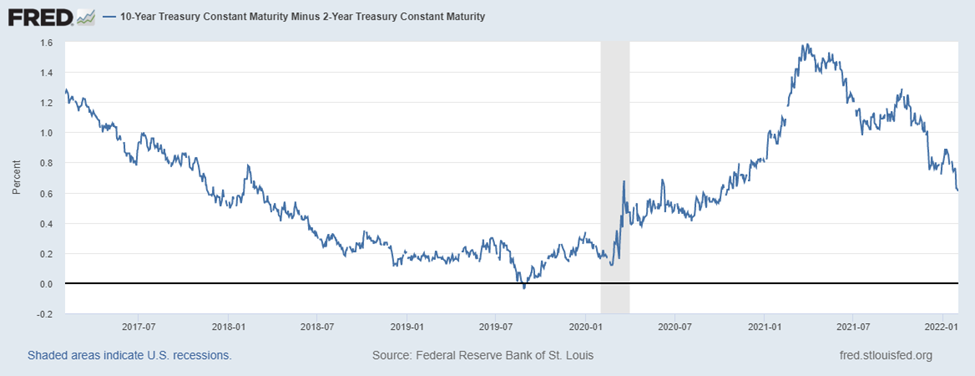
As the Fed pontificates about tapering and warns of upcoming rate hikes, the US Treasury yield curve has flattened, with the spread between the 2-Year and 10-Year recently contracting to near 60 basis points*. As most investors are likely aware, a flattening yield curve oftentimes leads to a recessionary economy. The below illustrates the flattening of the curve5. We think the economy has a high probability of a slowdown as we lap fiscal stimulus and potential tightening takes shape.
Meanwhile, we are seeing sell-side research firms revising their 2022 forecasts on cue, in line with where prices have headed. It is likely stock and bond market volatility may change the cadence of interest rate hikes. At the same time, inflationary readings may force the Fed’s hands. Below we show the expectations some of the sell-side banks currently have regarding future Fed moves6.
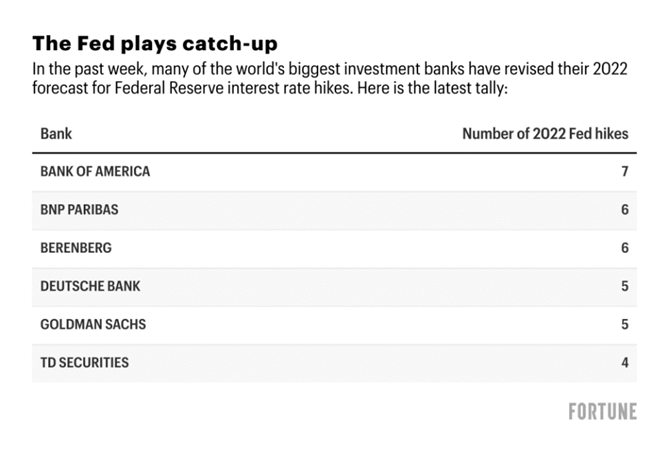
We are of the strong opinion that if the Fed hits even the bottom end of expectations – i.e., 4 rate hikes, the market volatility will provide for an eventful year and a disappointing one for growth strategies.
“While higher interest rates increase borrowing costs for all businesses, they also make firms’ projected profits worth less in investors’ valuation models. This is exacerbated for tech and other growth stocks whose peak earnings are not expected for years to come6." – Nigel Green, CEO of DeVere Group
PORTFOLIO UPDATE7
“Behold the turtle. He makes progress only when he sticks his neck out.” - James Bryant Conant
Leatherback entered 2022 with a sizable, long allocation in Activision Blizzard (ATVI). We made our first purchase of ATVI on November 22, 2021, when the stock traded at a little over $62. We accumulated shares over the subsequent weeks as we thought the value proposition was too glaring to ignore, as the stock traded to multi-year lows while maintaining a fortress balance sheet of $6B in net cash along with rich entertainment assets. To our pleasant surprise, and to start the third week of January, Microsoft Corp (MSFT) announced plans to acquire the company for $95 per share in cash. This was more than a 40% all cash premium with an expected closing in 2023. Notably, the stock initially hovered around $82 on the day the deal was announced and has since drifted to near $79 per share, or a roughly 17% discount to its expected takeout price. We believe the deal will undergo antitrust scrutiny but will ultimately be consummated. We expect to maintain a position until the deal discount closes.
We have been adding to Newmont Corporation (NEM) and have made it a top five position in our long portfolio. NEM is the only gold company in the S&P 500 and presently maintains a market capitalization of around $49B with minimal debt and a dividend yield of more than 3.5% at the time of writing this piece. In our opinion, the sentiment surrounding gold and gold stocks seems too bearish. In 2021 the Gold Spot price declined by over 3.6% while the NYSE Arca Exchange Gold BUGS Index fell by more than 12%. Over the last two years the money supply has exploded higher and inflation measures have spiked upward. Historically, these dynamics have been bullish for gold and gold stocks. We suspect that as risk taking appetites wane, sentiment surrounding gold stocks will improve and stock prices will march higher. We view NEM as the best proxy to participate in a strong rebound in gold and gold stocks.
On the short side of the ledger, we initiated a position in Planet Fitness (PLNT), a franchisor and operator of low price point fitness centers. PLNT boasts an almost $7.7B market cap with over 2,000 stores and 15 million members. The stock presently trades for nearly 17x revenues, over 100x estimated earnings and approaches 40x EBITDA*. PLNT thrives on customers paying monthly fees that are automatically swept from customer bank accounts. PLNT makes it easy to sign up for a subscription, but very difficult to cancel. Federal regulators have made it a priority to crack down on the widespread practice.
“If you click to subscribe, you should be able to click to cancel. FTC has made clear that to comply with the law, businesses must ensure sign-ups are clear, consensual, and easy to cancel.” – Lina Khan, Chair, Federal Trade Commission
Recently, Lina Khan tweeted out a video showing Planet Fitness as violating the policy. Next, PLNT has recently announced acquisitions of franchisees, including an $800mn acquisition of franchisee Sunshine Fitness. We question why a company whose business is based on franchising would be acquiring franchisees. Given what we think is the company’s high valuation and significant insider selling, we think a short position may prove fruitful.
FINAL THOUGHTS
Despite the tumultuous market dislocation in January, our Fund performed quite well posting positive performance. We are finding many compelling ideas both long and short and we look forward to continuing our dialogue in the weeks and months ahead.
