The Leatherback Long/Short Alternative Yield ETF (LBAY) (the “Fund”) NAV declined by 1.62% in September, compared to a decline of 4.65% for the S&P 500 Index. LBAY paid our tenth consecutive monthly distribution of $0.06 per share. This is a 3.63% SEC yield versus the S&P 500 Index dividend yield of approximately 1.37%, and the 10-Year US Treasury yield of approximately 1.49%. Year to date as of September 30, 2021, NAV for the fund has returned 15.43%, compared to 15.92% for the S&P 500 Index. Cumulative since inception (November 16, 2020) performance to date, NAV for the Fund has produced a 20.47% total return.
The performance data quoted represents past performance. Past performance does not guarantee future results. The investment return and principal value of an investment will fluctuate so that an investor’s shares, when sold or redeemed, may be worth more or less than their original cost and current performance may be lower or higher than the performance quoted. Performance current to the most recent month-end can be obtained by calling (833) 417-0090. The gross expense ratio for the fund is 1.09%.
View LBAY standardized performance here.
The Fund’s NAV is the sum of all its assets less any liabilities, divided by the number of shares outstanding. The market price is the most recent price at which the Fund was traded.
“Just the usual monthly reminder that… objective data will be subjectively interpreted to form stories. The easiest to understand and therefore most widely accepted will then drive crowd behavior.” - Peter Atwater
Risk capital tends to fall victim to recency bias. We make this statement with the belief that far too often, the crowd tends to view the world in reverse, through the distorted lens of the rearview mirror. This perspective focuses on what we have already seen, “learned”, or experienced in the very recent past. Remember, it was only 18 short months ago that oil prices turned negative! In April of 2020, the front month WTI crude oil contract settled at a negative $37.63 per barrel in New York3. The consensus view had been formed: oil was dead (read as un-investable), and pandemic impacts solidified the inevitable disappearance of the fossil fuel. Clean alternative energies appeared to succeed in driving the need for oil to extinction. This year began with the energy sector representing near the smallest portion of the S&P 500 index in its history, at just over 2%. How has that narrative been panning out in 2021?
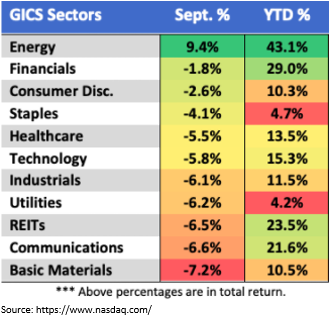
Year to date through the end of September 2021, the energy sector outperformed all others and posted a greater than 43% total return. During the month, the energy sector produced the only positive return, up over 9%4. As we write this, crude is now priced near $82 per barrel. Notably, four of the top ten performing S&P 500 stocks this year were in the energy sector.
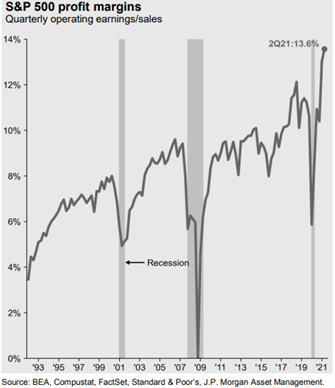
Through September, the S&P 500 has achieved record corporate net profit margins, which pierced 13.6% in Q2 of 2021. As seen below, this is the most profitable S&P 500 companies have ever been5.
After energy, the financial sector was the second-best performer year to date through September4. Notably, financial institutions have raked in record profits over the past year. Over the past four quarters, JP Morgan Chase & Co (JPM), Goldman Sachs Group Inc (GS) and Morgan Stanley (MS) have each reported their most profitable period ever6. A series of reserve releases, as well as record equity and debt issuance have contributed to driving the bottom lines of financial companies.
LOOKING OUT THE WINDSHIELD
We are now into the fourth quarter of 2021, and, in our opinion, the “transitory” inflation as pontificated by the Federal Reserve throughout 2021 becomes a narrative reflecting more “permanence”. Many earnings conference calls and interviews have included a common theme.
We believe the record in profit margins is unlikely to repeat in 2022. Cost inflation will impact margins negatively, and higher prices may have a negative impact on consumer sentiment. With potential indications the consumer may be starting to pivot at the same time banks are reporting record-breaking profits, we would not be surprised if some of the headlines of the future may look similar to a few we have created below:
We have noted in prior write-ups that the Federal Reserve seems to be losing some of their credibility as the “dual mandate” of maximum employment (undefined) and price stability (defined as 2%) has been exposed as a bit of fallacy. There is thinking that market prices may have been one of the drivers of their decision-making, given inflation has proven to be hotter than thought, employment requirements have been recognized as “all but met”, and some committee members are starting to acknowledge that policy may be impacting housing costs. Here is a small sample of some thoughts that are already indicative that the above created headline examples may turn out to be more than a possibility, but may be probable:
It is possible that we are witnessing the beginning of the fallout from the growing role of the world’s Central Banks in asset and debt markets globally. We would not be surprised if the Federal Reserve begins to see serious blowback from the public if there ends up being a perceived spot needed to place blame. Recently, actions by some members of the Federal Reserve have come under question, with a few presidents even moving on from their posts. The Chair appears to have found himself as the focus of some of the well-known players in Washington. Given the thought that this stock market is supported by the foundation of Central Bank confidence, we are curious to see what shakes out during the next several months, and into next year’s election cycle.
PORTFOLIO UPDATE7
We continue to maintain long positions in Comerica Inc (CMA) and Popular (BPOP), both of which have reported what we think are strong fundamentals and have benefited from the benign credit environment. CMA and BPOP trade at an approximately 11x and 8x forward price to earnings multiple and pay an approximately 3.1% and 2.2% dividend yield, respectively8.
Additionally, we have been adding to our long position in PotlatchDeltic Corp (PCH) which is an approximately $3.6 billion timber REIT with what we think are reasonable debt levels and a little greater than a 3% dividend yield8. PCH has the highest direct leverage to lumber prices of the timber REITs, owning some 1.8 million acres of timberland primarily across Idaho, Minnesota, and the southern states of Alabama, Arkansas, Louisiana, and Mississippi. Lumber prices rose significantly this year, then bottomed in August, and have been rallying since then which we think should benefit the prospects for PCH.
We are mindful there are interesting possibilities as we head toward the end of the year. No matter how it plays out, we think there are opportunities to explore, and we look forward to continuing our dialogue in the weeks and months ahead.
