The Leatherback Long/Short Alternative Yield ETF (LBAY) (the “Fund”) NAV advanced by 4.21% in May, compared to 0.70% for the S&P 500 Index. LBAY paid our sixth consecutive monthly distribution of $0.06 per share. This is a 3.13% SEC yield versus the S&P 500 Index dividend yield of approximately 1.37%, and the 10-Year US Treasury yield of approximately 1.59%. Year to date as of May 31, 2021, NAV for the fund has returned 19.90%, compared to 12.62% for the S&P 500 Index. Cumulative since inception (November 16, 2020) performance to date, NAV for the Fund has produced a 25.13% total return.
The performance data quoted represents past performance. Past performance does not guarantee future results. The investment return and principal value of an investment will fluctuate so that an investor’s shares, when sold or redeemed, may be worth more or less than their original cost and current performance may be lower or higher than the performance quoted. Performance current to the most recent month-end can be obtained by calling (833) 417-0090. The gross expense ratio for the fund is 1.09%.
View LBAY standardized performance here.
The Fund’s NAV is the sum of all its assets less any liabilities, divided by the number of shares outstanding. The market price is the most recent price at which the Fund was traded.
As we approach summer, daily activities seem to be returning to normal. Both the vaccinated and those that chose not to vaccinate, have resumed daily life nearly back to normal. Notably, as families plan their summer travel plans, the transitory effects of inflation begin to become real as gas tanks are filled and families begin consuming again. Here is a sprinkling of headlines that have recently caught our attention:
As normalcy returns to daily life, equity markets have been grinding higher in anticipation of stronger economic activity. Bond markets seem to have taken Fed comments at face value surrounding transitory inflation as interest rates have stalled recently. The next several months are likely to experience increased interest rate and stock volatility as markets digest a more normal economic environment and begin to reset expectations on 2022 earnings and beyond.
Fully invested market participants love narratives to explain bull markets, and, more importantly, reasons for bull markets to continue. Presently, there are plenty of story lines to feed risk appetites, with Fed support being a predominant one. The anticipation of the pent-up consumer demand, i.e., the re-opening trade, has driven many early cyclical and consumer discretionary stocks significantly higher – many higher than pre-COVID levels. Roaring Twenties is a nice catchy parallel to the 1920s to insinuate this short-term prosperity is here for the next decade; the sell-side banks peddling this rarely mention the crash and Great Depression that followed. No matter the narrative, it is no question stocks have re-rated higher in anticipation of a blowout first quarter earnings season which did not disappoint.
Perhaps, the Fed may soon change their tune and begin to talk about tapering and raising rates? In our opinion, investor sentiment going forward will depend on the validity of the transitory nature of inflation as told by the Fed. It is our strong belief asset markets have remained ebullient in large part due to massive fiscal and monetary stimulus. The direction of inflation will force the Fed’s hand. We note that the historical Fed mandate of targeting 2% inflation was revised to a mandate of seeking inflation that runs hotter than would have otherwise been palatable just a year or so ago. This is a move that is being overly debated by market participants. After this tweak to the mandate, inflation started cropping up in the economic numbers over the past few months. Given this uncertainty, the Fed didn’t stop with this shift and moved the goal posts just a bit further. The next iteration of their inflation measurement guideline switched over to targeting unspecified amounts of inflation in wages. What happens if wages, which we discuss a bit later, do in fact heat up as well, and then are unable to be reigned back in? Well, we think it may simply be time to take the masks off so we may get a look at whether it is time for the Fed to pivot from talking about talking about tapering to beginning to taper. Or perhaps since we are a few months into the temporary inflation timeline, it’s possible a revelation may occur, and the Fed may even raise short term interest rates.
Inflation is popping up everywhere – and will soon dent profit margins. We can dissect this a bit given the backdrop of inflating prices more broadly. We start with record corporate profits, and work toward how this may look over the next several quarters. We believe the most recent reported profit margins, as shown in the below chart7, may prove unsustainable.
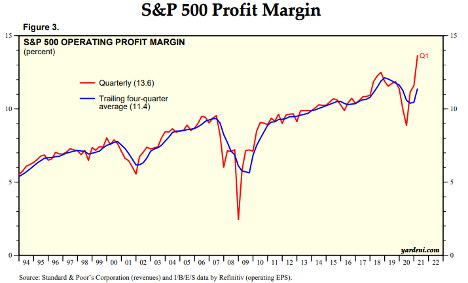
Commodity and raw material prices have increased, resulting in input cost inflation. There are wage pressures seen in many industries, with many of these upward labor costs seen upstream in the supply chain. The cost of receiving delivery of these inputs, as well as the cost of final delivery of end-use products has increased, with shipping and transportation rates and available freight capacity at a premium. Take the cost pressures a step further into fixed cost contemplation for adding additional required capacity or equipment. Add to this, we are in the beginning innings of a new administration that is already discussing new tax and regulatory regimes. Finally, we are reverting out of a zero-interest rate world where the financing costs for firms may tick higher.
When taken in sum, all of these component examples of “cost inflation” may be significant. When applying these costs against revenues that may or may not be fully inelastic when attempts to pass these costs on to consumers takes place, we may see margins contract, and contract meaningfully.
SELL IN MAY AND GO AWAY?
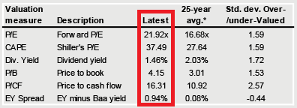
Despite continued impressive earnings reports and more announced fiscal stimulus, equity market returns in the month of May turned out to be, well, fairly uneventful. The NASDAQ and technology stocks (XLK) declined 1.44% and 0.93% while the broader indices finished close to flat. This happened as interest rates across the curve shifted modestly lower. Perhaps equity markets are becoming fatigued? Below we show the extreme overvaluation the current equity market reflects8.
Reported earnings growth and margin expansion have led to multiple expansion. We believe the trailing 12-month performance of the broad market indexes has been robust, to say the least. The numbers are even more impressive when considering the 13 to 14-month numbers, which factor in the preferred parlance “base effects”. Coincidentally, we have seen an interesting theme play out for many companies over the past several months which began during the previous earnings cycle:
Markets interpreting bad news as good news transitioned to the concept (or realization) that even great news may be bad news with respect to impact on share prices after earnings releases.
This has resulted in the first quarter earnings season, and the month of May in particular, to be less than eventful from a topical and directional guidance perspective. What happened?
We won’t know for sure until we see how the summer plays out. In any case, we think there are opportunities to explore both long and short when the enthusiasm returns, and we look forward to continuing our dialogue in the weeks and months ahead.
Learn more about Leatherback ETFs
 |
