The Leatherback Long/Short Alternative Yield ETF (LBAY) (the “Fund”) NAV advanced by 2.69% in August, compared to an advance of 3.04% for the S&P 500 Index. LBAY paid our ninth consecutive monthly distribution of $0.06 per share. This is a 3.62% SEC yield versus the S&P 500 Index dividend yield of approximately 1.30%, and the 10-Year US Treasury yield of approximately 1.31%. Year to date as of August 31, 2021, NAV for the fund has returned 17.33%, compared to 21.58% for the S&P 500 Index. Cumulative since inception (November 16, 2020) performance to date, NAV for the Fund has produced a 22.46% total return.
The performance data quoted represents past performance. Past performance does not guarantee future results. The investment return and principal value of an investment will fluctuate so that an investor’s shares, when sold or redeemed, may be worth more or less than their original cost and current performance may be lower or higher than the performance quoted. Performance current to the most recent month-end can be obtained by calling (833) 417-0090. The gross expense ratio for the fund is 1.09%.
View LBAY standardized performance here.
The Fund’s NAV is the sum of all its assets less any liabilities, divided by the number of shares outstanding. The market price is the most recent price at which the Fund was traded.
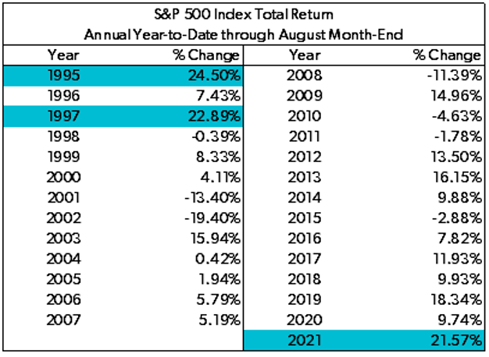
That escalated quickly, and it is truly captivating. We just witnessed the strongest performance of the S&P 500 Index through the end of the month of August going back to before the turn of the century. Through August, we have witnessed 53 new all-time high trading days in 20213. Isn’t that a big deal?
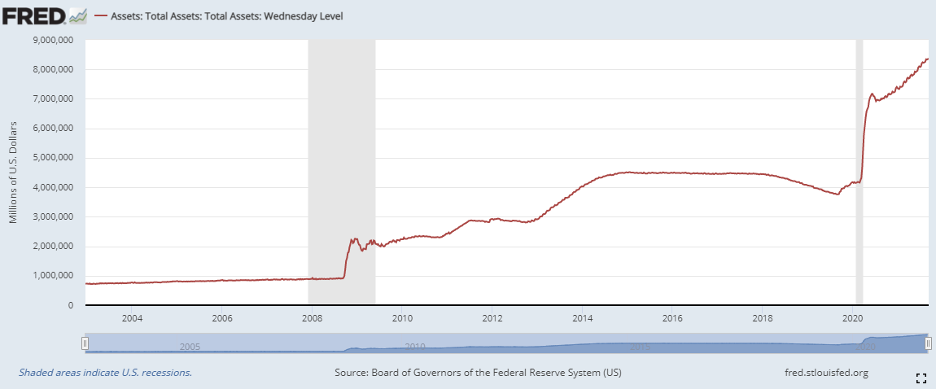
Coincidentally, the Federal Reserve balance sheet had also grown to an all-time high of $8.34T by the end of August, which is nearly double the $4.24T pre-COVID level during March 2020, and up over 13% from $7.36T at year-end 20205. The Federal Reserve is in growth mode and market participants have taken notice.
“We’ve been a Republic since 1776. Forty percent of ALL dollars were born (printed) since 2020.” – Mark Yusko
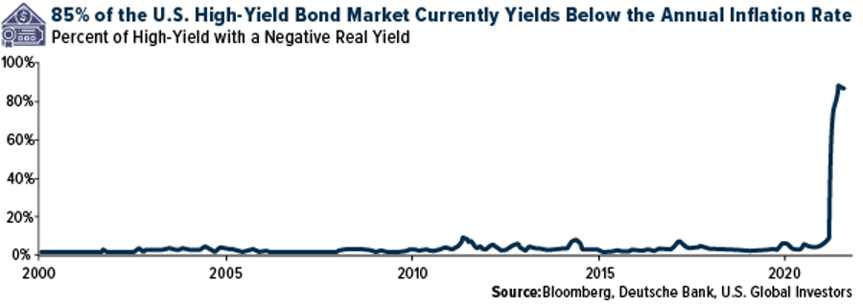
This newly printed money has found its way in to noteworthy and headline-grabbing investments – SPACs, NFTs, cryptocurrencies, meme stocks, cloud computing stocks and invisible statues. A large portion of the high yield bond market now maintains negative yields in real terms when compared to the consumer price index (CPI)6.
How did we get here? Financial news and other media outlets gushed as new high after all time high was put in for US indexes throughout 2019 and into early 2020, until the world changed. We all know too well what happened next, and then policy took over. We’ve outlined this throughout our past commentaries, but here we go again: the Fed removed the brakes from the car, filled the tank with stimulus money, put their foot on the gas, and we’ve been full throttle ever since March 2020.
“I hereby implore the Federal Government to stop implementing ‘stimulus programs’ while simultaneously touting ‘economic success’”. – Jeff Gundlach
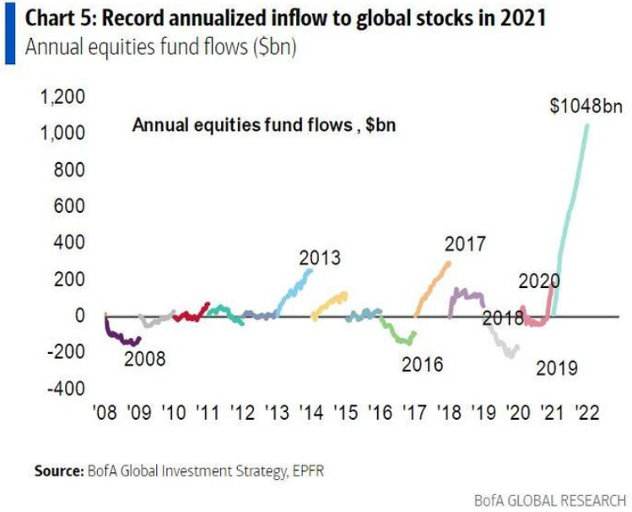
Globally, the flows into stocks during 2021 have topped $1 Trillion. “The $1 trillion that has flowed to global stocks in 2021 is bigger than the last 20 years combined3.” Notably, the Bloomberg World Exchange Market Capitalization of global equities topped $120T for the first time ever early this September4.
The year 2021 has seen spurts of momentum from varying sectors during the year as inflation (or deflation) and COVID headlines have dominated the market narrative. Technology names were in the driver seat as interest rates were hitting all-time lows. The consumer was in the back seat, and value was being stored in the trunk. Then the market seemed to start with the realization that consumers were ready to ride up front and were willing to spend their recently enhanced savings on just about anything and everything, but at prices that seemed to be upwardly adjusted. This was the reopening and reflation theme playing out. Interest rates started to rise, and technology and unprofitable companies began to falter a bit. When this occurred, a long-awaited rotation took hold, with consumer discretionary, value, and names with inflation exposure catching a bid and throwing themselves up front. Then, the Fed spoke about tapering, acknowledged the definition of transitory may be fluid, and expressed concerns with employment levels. Headlines became more frequent around the potentially uneasy state of the consumer going forward. This was coupled with fears of variants and a path forward with the virus. The deflation theme took the day. Interest rates fell again, although not as far as before the recent bond sell-off, and technology put the seat belt back on and reclaimed its place as driver, with growth continuing to enjoy the scenery from the passenger seat.
SELF-DRIVING POLICY
So, here we are. The sound of the helicopters has started to disappear into the distance as many of the programs initiated during 2020 in an effort to kickstart the economy are winding down. There is concern percolating with market-watchers that many of us in the country were relying on these programs as a livelihood replacement. With the vacuum that is being left behind as the policies conclude, the unknown is where that leaves the consumer at large. At the time of this writing, the latest job openings numbers increased further to almost 11 million, while jobless claims and continuing claims showed no meaningful change. Below is a visual of the growth in Federal Reserve Total Assets (Not Seasonally Adjusted)7:
The Fed has hinted that tapering of open market purchases may start to occur, but this take is being adjusted day by day by the market. What will these small changes by the Fed mean given they are currently operating with their largest balance sheet in history? Recently, there appeared to be an insatiable appetite for companies to secure funding at these interest rate levels. Is the rush taking place before there is an unfavorable adjustment? Who knows if the hints of slowing down the easy money will materialize? We are mindful as well that the latest spending package is in flux, talks of taxes are back to the fore, and the cycle is about to ramp up for next year’s elections.
Also, as we noted in our last commentary, we expect to hear more about the debt ceiling show-down that is approaching. There have already been talking points from the Treasury circulating in the press about how inaction could lead to a U.S. debt default. We expect this topic to hit the news cycle with a fever pitch in the coming weeks.
PORTFOLIO UPDATE
As we approach the 4th quarter of 2021, we believe today’s market sentiment and behavior will continue to be reliant on ultra-low long-term interest rates. With that being said, we continue to have conviction in many idiosyncratic (single stock) ideas – companies that we think have strong fundamentals and are trading at attractive valuations with income streams. In our opinion, very few current market participants are investing based on bottom-up fundamental research in individual security ideas. We think quantitative, passive, thematic and narrative driven investors tend to dominate the market with little focus on valuations. While frustrating, it presents an opportunity to uncover interesting companies trading at what we think are attractive valuations and, conversely, names that appear overvalued and stretched due to momentum and money flows.
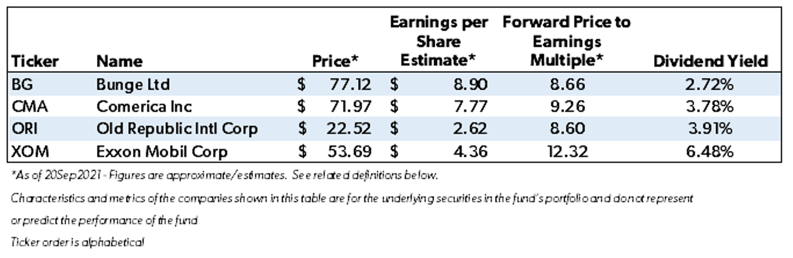
Among our largest long common stock holdings, we own4,8:
Conversely, on the short side of the portfolio, we are growing cautious on consumer stocks as a significant amount of US consumption may have been driven by stimulus payments which are now being removed. For example, we continue to maintain a short position in Peloton Interactive Inc (PTON). The stock recently rallied on the back of the news that the company is launching an apparel line under the Peloton brand name. Peloton immediately added almost $5B of value on this announcement, or the equivalent of approximately over half of Under Armour Inc’s (UAA) market cap. Additionally, we have recently added exposure to SeaWorld Entertainment Inc (SEAS). SEAS recently traded near $55.65, or an approximately 50% premium above its pre-COVID high (Feb 2020) of $36.88. SeaWorld enjoyed a recent surge in summer guests who vacationed and may have utilized their stimulus checks in the process. We think as we enter 2022, revenues may be pressured, and labor costs may negatively impact real earnings power. We think the stock may sell off as fundamentals reset.
How we arrived at this point in the cycle, and how the road will look on the other side of the horizon may prove to be two completely different paths. No matter how the view turns out, we think there are opportunities to explore, and we look forward to continuing our dialogue in the weeks and months ahead.
