The Leatherback Long/Short Alternative Yield ETF (LBAY) (the “Fund”) NAV advanced by 0.31% in October, compared to an advance of 7.01% for the S&P 500 Index. LBAY paid our eleventh consecutive monthly distribution of $0.06 per share. This is a 3.48% SEC yield versus the S&P 500 Index dividend yield of approximately 1.30%, and the 10-Year US Treasury yield of approximately 1.55%. Year to date as of October 31, 2021, NAV for the fund has returned 15.79%, compared to 24.04% for the S&P 500 Index. Cumulative since inception (November 16, 2020) performance to date, NAV for the Fund has produced a 20.84% total return.
The performance data quoted represents past performance. Past performance does not guarantee future results. The investment return and principal value of an investment will fluctuate so that an investor’s shares, when sold or redeemed, may be worth more or less than their original cost and current performance may be lower or higher than the performance quoted. Performance current to the most recent month-end can be obtained by calling (833) 417-0090. The gross expense ratio for the fund is 1.09%.
View LBAY standardized performance here.
The Fund’s NAV is the sum of all its assets less any liabilities, divided by the number of shares outstanding. The market price is the most recent price at which the Fund was traded.
“As long as the music is playing, you’ve got to get up and dance….We’re still dancing.” - Chuck Prince, Former CEO of Citigroup in July 20073
Risk assets rose during the month of October. The Dow, S&P 500, NASDAQ, Russell 2000, and Wilshire 5000 have all recently hit all-time highs4. Total US stock market capitalization, as defined by the Wilshire 5000 Total Market Index has added over $8 trillion to its total market capitalization in 2021 through the end of October. This is the equivalent of approximately 35% of US Gross Domestic Product* of roughly $23 trillion5. The Wilshire 5000 market cap is presently at an all-time high of over $48 trillion, resulting in a Total US Market Cap to GDP ratio of over 200%, which is the highest level of all-time for the “Buffett Indicator”6.
As we write this, there are at least 70 stocks in the S&P 500 that trade for over a 10x multiple of price to sales*. The NASDAQ 100 Stock Index7 forward price/sales ratio* recently notched a new all-time high that is over 5.6x8. Take a look at the percent of US stocks trading over 10x price/sales as of late9….
PERCENT OF US STOCKS TRADING OVER 10x Price/Sales
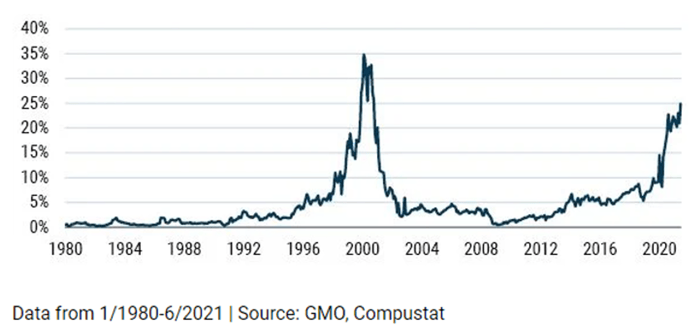
….and then read this reflection by a CEO who lived through similar valuations during the 2000s tech bubble:
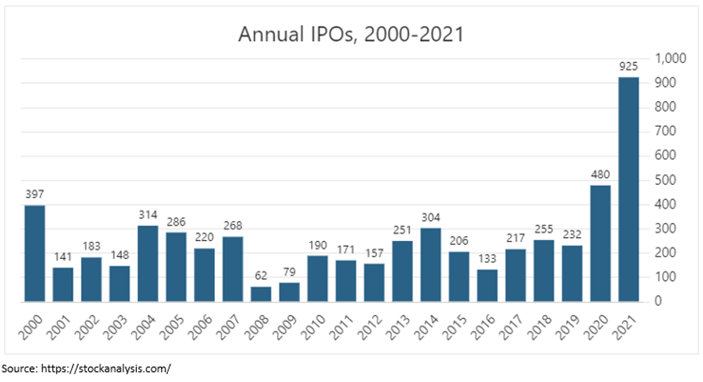
With the overall fervor in risk asset valuations, not surprisingly, investment banks have been capitalizing on the market environment with US initial public offerings experiencing an all-time record year. Look at the quote and visual below, with 925 IPOs (including SPACs) already coming to market in 2021 as we write this12.
During the first week of November, the market cap of cryptocurrencies surged to all-time highs, piercing $3 trillion in market value for the first time ever14. With all the speculation in asset markets, we find the US equity options market ebullience alarming and potentially disruptive to stock markets. Notably, options trading continues to rise to record levels this year. A recent article noted, “By one measure, options activity was on track to surpass trading in the stock market for the first time ever.15”
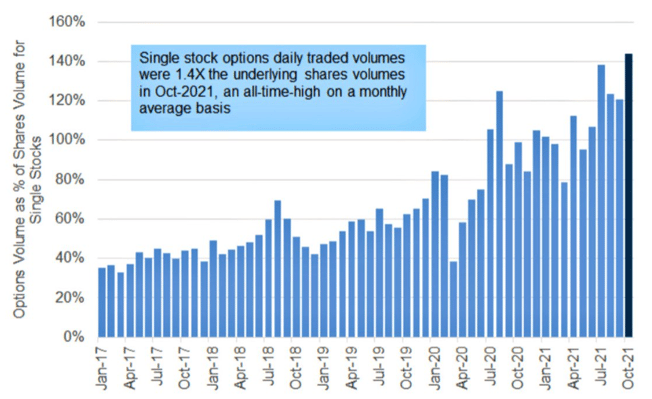
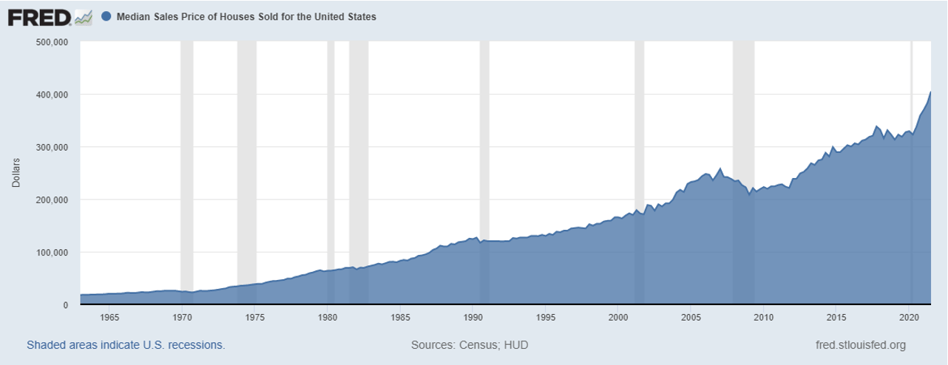
During the housing market bubble in the 2000s, the market for insuring home mortgages grew larger than the market for houses. Now, as the above visual shows, the stock options market appears to have become bigger than the underlying US stock market itself16!
“Derivatives are the Market… Liquidity is distorting the market.” - Cem Karsan of Kai Volatility
Avis Budget Group Inc (CAR) stock rose over 100% in one day on November 2nd, bringing its year-to-date total return to up over 800% on that date. AMC Entertainment Holdings Inc (AMC), which had an up 300% stock move in one day back in January has a total return that is up over 1,500% year-to-date as we write this17. In our opinion, the options market has caused major distortions in many individual stocks, which has had significant ripple effects on index holdings as well. For those that own a passive position in the iShares Russell 2000 ETF (IWM)18, did you know that your two biggest holdings are CAR and AMC19?
PLEASE STOP THE MUSIC
The Federal Reserve continues to maintain 0% interest rates while purchasing $120 billion per month of US debt to support the economy (and we argue, US stocks), including $40 billion in mortgages per month to support the US housing market; the Fed recently announced it will finally begin to “taper”, which means buying $15B less per month beginning soon. The Federal Reserve announced on November 3rd that tapering will begin later in the month. To summarize, the Fed essentially stated the following.
The Fed has made no determination on when it may raise interest rates. We think the next several weeks will be eventful as the future make-up of the Federal Reserve is at stake. Who will be at the helm when the next rate decision is made? Perhaps, it’s not Jay Powell, but Lael Brainard?
PORTFOLIO UPDATE20
As we approach the Thanksgiving holiday, households with assets (equities, homes, art, cryptocurrencies, etc) have much to be thankful for. As wild and as powerful as the market sentiment has been, we have been pleased with the performance of many of our stock ideas. Our long positions have reported strong results, including Old Republic Intl Corp (ORI) and Bunge Ltd (BG). Interestingly, as part of its earnings day release, Old Republic announced that long-time Chairman Aldo Zucaro stepped down, with immediate effect; as long-time followers of the company, we think this may portend strategic actions at the company. We maintain our long position. We think Bunge will continue to benefit from rising demand in agriculture; it remains our largest position. On the opposite side of the ledger, the short book has been a mixed bag. We have had success in shorts such as in Peloton Interactive Inc-A (PTON), UTZ Brands Inc (UTZ) and Ollie’s Bargain Outlet Holdings (OLLI). However, short positions in stocks trading at over 10x sales, where we have significant short exposure, have been detractors as they have continued their relative market strength.
In summary, we see a highly constructive setup for long/short strategies, and we look forward to continuing our effort and our dialogue with investors as we approach year end.
