The Leatherback Long/Short Alternative Yield ETF (LBAY) (the “Fund”) net asset value (NAV) declined by 0.24% in December, compared to a decline of 5.76% for the S&P 500 Index. LBAY paid our twenty-fifth consecutive monthly distribution, at $0.075 per share in December. This is a 2.24% SEC yield versus the S&P 500 Index dividend yield of approximately 1.76%, and the 10-Year US Treasury yield of 3.877%. Year to date as of December 31, 2022, NAV for the Fund has returned 22.39%, compared to a decline of 18.11% for the S&P 500 Index. NAV performance for the Fund to date since inception (November 16, 2020) has produced a 56.33% cumulative total return and a 23.42% annualized total return.
The performance data quoted represents past performance. Past performance does not guarantee future results. The investment return and principal value of an investment will fluctuate so that an investor’s shares, when sold or redeemed, may be worth more or less than their original cost and current performance may be lower or higher than the performance quoted. Performance current to the most recent month-end can be obtained by calling (833) 417-0090. The gross expense ratio for the fund is 1.32%.
View LBAY standardized performance here.
The Fund’s NAV is the sum of all its assets less any liabilities, divided by the number of shares outstanding. The market price is the most recent price at which the Fund was traded.
WE EXPECT TRIED-AND-TRUE INVESTMENT STRATEGIES TO THRIVE IN 2023 AND BEYOND
From 2008 until 2022, the US Federal Reserve Board (the Fed) suppressed interest rates, implemented quantitative easing, and created money out of thin air. Fed actions encouraged market participants to speculate in a host of financial assets. The greatest rewards were reaped in US equities. Specifically, levered long beta* strategies favoring growth investments outperformed most investment strategies, and proved fruitful for over a decade. In 2022, the zero-interest rate party ended as the Federal Reserve implemented a series of aggressive rate hikes with seven increases from March through December. As the Fed engineered its rate hiking path, financial assets struggled throughout 2022 with the total returns of the S&P 500 Index falling by over 18%, the growth heavy NASDAQ Composite Index collapsing by more than 32%, and the Dow Jones Industrial Average declining by almost 7%. US Bonds declined similarly with broad-based investment grade bonds falling by 13%, corporate bonds by almost 16%, high yield bonds by over 11%, mortgage-backed securities by nearly 12%, and “safe haven” Treasuries by more than 12%! To wrap up the year, the 60/40 model fell by nearly 17%**.
“Interest rates are to asset prices what gravity is to the apple. When there are low interest rates, there is a very low gravitational pull on asset prices.” – Warren Buffett
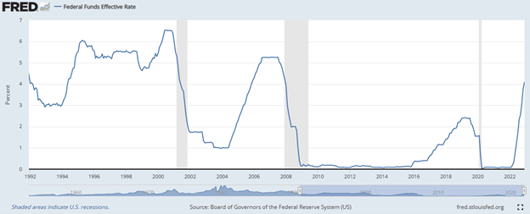
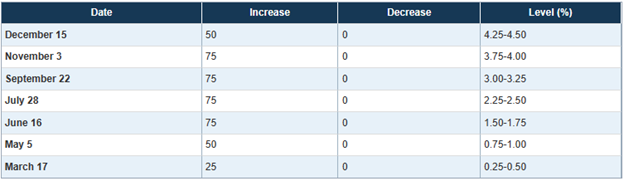
Below is a visual showing the Fed interest rate actions over the past 30 years, with a 2022 summary table outlining the rapid hikes totaling 4.25% (425 basis points*) during the year3:
As we initially discussed during the first quarter of 2022, we think tighter monetary policy and higher volatility coupled with passive investment flow shifts should lead to price dislocations and, importantly, true price discovery. In our opinion, the setup for tried-and-true alternative strategies such as long/short, capital structure arbitrage and managed futures appear particularly favorable as we enter 2023. Notably, the setup in 2022 was a healthy one for short selling strategies, as many equities with valuations we viewed as launched into the stratosphere coming back down to earth.
“We believe 2022 will be ripe for stock picking. We think fundamentals matter, and the opportunities that are available may lead to 2022 being an alpha-generating* year for short selling.” – Leatherback Asset Management, January 2022
We believe 2023 will be opportune for fundamental investing styles, and the craft of good old fashioned financial statement analysis is paramount. We imagine 2023 may be a continuation of 2022 as short candidates appear numerous, albeit not quite as plentiful as a year ago.
THE VANISHING OF NEGATIVE YIELDING DEBT
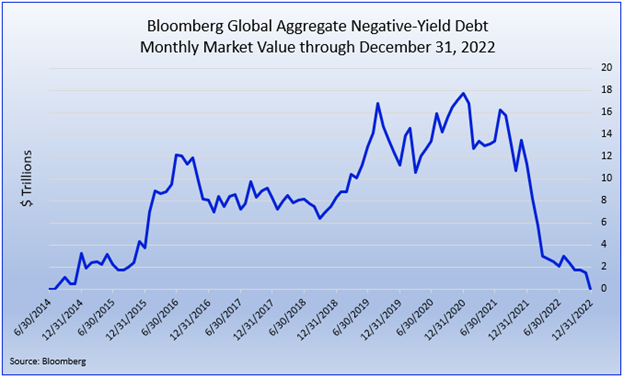
Another indication that the world of financial instruments is normalizing can be witnessed in the sovereign debt markets. We think price discovery is returning as Central Banks remove support. In April 2022, we found a bond market paradigm that seemed very telling and had to question whether the negative interest rate experiment was ending. Now, we have the answer, and cash is back to having a tangible value associated with it in the form of earning interest. When we posited the question early last year, the market value of negative-yielding debt globally has just slid to below $3 Trillion after reaching $18 Trillion during the pandemic. The global market value is now trending to near zero in bond market terms and stood at just over $24 Billion to end the year4. We think the below visual is staggering:
PORTFOLIO UPDATE5
While the Fund certainly had its share of detractors in 2022, we are proud with the number of names that positively contributed to performance. Both long and short positions provided positive attribution to the portfolio for the year ended December 31, 2022. Notably, short positions in Carvana Co (CVNA), Silvergate Capital Corporation (SI), and SVB Financial Group (SIVB) were the largest short winners on the year. At the time of this writing, we are no longer short CVNA or SI but remain short SIVB. No short position materially detracted in 2022. On the long side, Exxon Mobil Corporation (XOM), H&R Block, Inc. (HRB) and Lancaster Colony Corporation (LANC) were all important positive contributors on the year. Our three largest long detractors included Hasbro, Inc. (HAS), Fidelity National Information Services, Inc. (FIS) and EPR Properties Preferred Shares (26884U208). At the time of this writing, we continue to remain long all six names.
As we enter 2023, we remain short Tesla Inc. (TSLA), a short position we have maintained since 2020. We believe the current slide in TSLA will continue unabated. While we have no unique thesis outside of what many pundits have articulated, we share the view that TSLA engages in aggressive accounting, is experiencing weakening demand for their electric vehicles, maintains abysmal corporate governance (including a promotional CEO and dilutive share compensation), and faces well-financed competition. We believe the catalyst for TSLA stock declining further will simply be “gravity”. We believe higher interest rates, weaker market sentiment, and the law of large numbers (TSLA maintains an over $340 Billion market capitalization as we write this) will finally force TSLA valuation more in line with its capital-intensive automotive peer group.
View LBAY top 10 holdings here. Holdings are subject to change. Characteristics and metrics of the companies shown are for the underlying securities in the fund’s portfolio and do not represent or predict the performance of the fund. There is no guarantee that a company will pay or continually increase its dividend.
FINAL THOUGHTS
Leatherback is thankful for those that have entrusted us. Our goal has been to provide institutional quality long/short investing alternatives to the masses in a fully transparent, and potentially tax efficient Exchange Traded Fund (ETF)6. As we enter the new year, we hope you consider us for an allocation in 2023 and beyond.
