

The Leatherback Long/Short Alternative Yield ETF (LBAY) (the “Fund”) net asset value (NAV) increased by 10.53% in October 2026, compared to a decline of -0.87% for the S&P 500 Index. LBAY paid our 71st consecutive monthly distribution, at $0.085 per share in October. This is a 2.77% SEC yield versus the S&P 500 Index dividend yield of approximately 1.05%. Year-to-date, the net asset value of LBAY has increased by 16.60%, compared to an increase of 11.77% for the S&P 500. The Fund’s correlation to the S&P 500 is -0.19 as of 10/31/2026.

The performance data quoted represents past performance. Past performance does not guarantee future results. The investment return and principal value of an investment will fluctuate so that an investor’s shares, when sold or redeemed, may be worth more or less than their original cost and current performance may be lower or higher than the performance quoted. Performance current to the most recent month-end can be obtained by calling (833) 417-0090. The gross expense ratio for the fund is 1.27%.
View LBAY standardized performance here.
The Fund’s NAV is the sum of all its assets less any liabilities, divided by the number of shares outstanding. The market price is the most recent price at which the Fund was traded.
*The S&P 500 Index includes 500 leading companies and covers approximately 80% of the available market capitalization. The S&P 500 Dividend Yield is the estimated sum of all dividends paid by the index’s stocks in the last 12 months, divided by the index market capitalization as reported by the S&P. The dividend yield does not represent or predict the performance of the Fund. Indexes are unmanaged and it is not possible to invest in an index. The 30-day SEC yield is calculated with a standardized formula mandated by the SEC. The formula is based on maximum offering price per share and does not reflect waivers in effect. The 30-day SEC yield is calculated from the 30 days ending on the last day of the previous month. This figure reflects income less expenses and approximates the yield an investor would receive in a 12-month period if a fund continues earning the same rate for the rest of the year. View the 30-day SEC yield here. The US Treasury yield reflects the interest rate the US government could expect to pay to borrow money for different periods of time.
THE TIDE GOES OUT ON MOMENTUM
October brought another month where the broad market index performance masked significant shifts in underlying market dynamics. Although the S&P 500 slipped less than 1% during the month, momentum unwound sharply, reflected in the MSCI USA Momentum Factor Net Total Return Index decline of roughly 10.87%. The AI infrastructure trade came under heavy pressure as investors looked harder at AI financing, and interest rates remained elevated, with the 10-year Treasury yield above 5% for most of October. Renewed tensions in the U.S.-Iran conflict pushed Brent crude over $110 per barrel as markets priced in potential supply disruptions.
During the month, capital rotated into tangible, cash-generating businesses with shareholder-friendly management teams. As we discussed in our Second Quarter 2026 Review, we expected performance to broaden within the market, and we have built our portfolio for this type of environment. Both long and short books contributed to LBAY’s performance in October with our long exposure to energy and special situations leading the way. Driven by these shifting market dynamics and capital rotation, we see outsized price swings in specific names as temporary dislocations and are actively taking advantage of them.
"A quarter of every American business, plus or minus, is owned by some combination of Vanguard, State Street and Northern Trust… When you shrink the float of a public company, the marginal buyer and seller is going to have more impact on the stock price. The marginal buyer and seller today is a Citadel or a Millennium… they operate with a large amount of leverage, very large gross books of capital, and they're increasingly short-term… Most investors today are very short-term focused because they're compensated that way… they won't invest in a company unless they're confident the price is going to be higher on December 31st." —Bill Ackman, Holy Grail of Investing Podcast, September 8, 20261
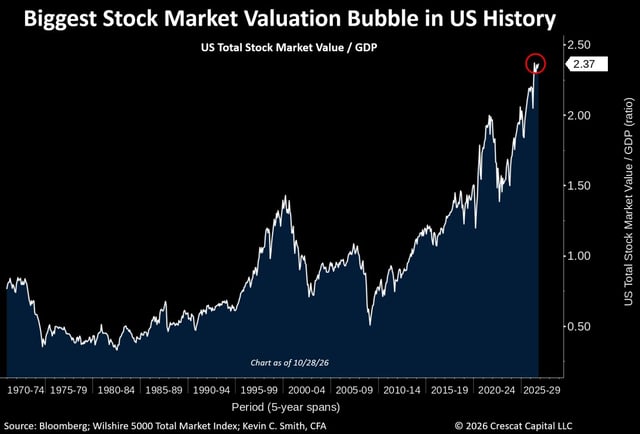
As of 10/28/2026 (Source: https://x.com/crescatkevin/status/2116571160934756731)
INDIVIDUAL CONTRIBUTORS
Range Resources (RRC). Shares of the natural gas and natural gas liquids producer surged after EQT agreed to acquire the company in an all-stock deal. Strong quarterly results and positive investor sentiment around natural gas further supported the stock.
Lamb Weston Holdings (LW). The frozen food producer saw its stock jump higher after quarterly results beat expectations, and the company raised its fiscal year 2027 outlook.
Keurig Dr Pepper (KDP). The company announced a strong quarter, beating expectations across multiple metrics. Investors grew more confident in the company’s decision to separate into beverage and coffee companies, also pushing the stock higher during the month.
ExxonMobil (XOM). Exxon shares posted another month of solid performance on higher oil prices and strong refining margins. Additionally, the company announced a $20 billion buyback plan for 2027.
Other notable contributors in the long portfolio included Visa (V), Essential Utilities (WTRG), and Vail Resorts (MTN). Within our short book, several speculative technology and AI names we have scrutinized historically experienced significant declines. Key contributors among this group included CoreWeave (CRWV), IonQ (IONQ), Credo Technology (CRDO), Astera Labs (ALAB), Western Digital (WDC) and AppLovin (APP).
DETRACTORS
Our gold and silver miners were the main detractors in October as the price of gold retreated. Elevated inflation caused investors to worry about a more hawkish Fed. As a group, our positions in Hecla Mining (HL), Alamos Gold (AGI), Barrick Mining (B) and Newmont (NEM) weighed on performance for the month. However, our thesis holds, and we remain constructive on these companies amid persistent government deficits and money printing. We took the opportunity to selectively add to some of our positions.
“We view the recent selloff as a period of consolidation within an ongoing bull market in precious metals.” —Haywood Securities, quoted in MINING.COM, October 27, 20262
SLM Corp (SLM). Sallie Mae stock traded lower during the month after the company announced lackluster quarterly results and lowered its full-year guidance. Management chose not to complete a previously planned whole-loan sale after determining that market pricing failed to meet its return threshold, and it chose to retain the loans instead. We continue to believe in the long-term case for SLM, and the company has consistently returned capital to shareholders through buybacks and dividends.
NOTABLE ACTIVITY
S&P Global (SPGI). We initiated a long position in S&P Global, a leading provider of credit rating services, indexes, and market data. The company holds a strong competitive position with high barriers to entry for its business, and it generates durable recurring revenue. In addition to its strong quarterly results, we believe the company will further benefit from increasing debt issuance and demand for market data. S&P Global reaffirmed expectations to return more than $7 billion to shareholders through buybacks in 2026.3
Rigetti Computing (RGTI). We took gains and covered our short position in Rigetti Computing after short interest in the stock grew beyond 20%. Our risk management process places a threshold on short interest to avoid being caught in “squeezes”.
LOOKING AHEAD
As of the end of October, we are only 3% off the all-time highs on the S&P 500:
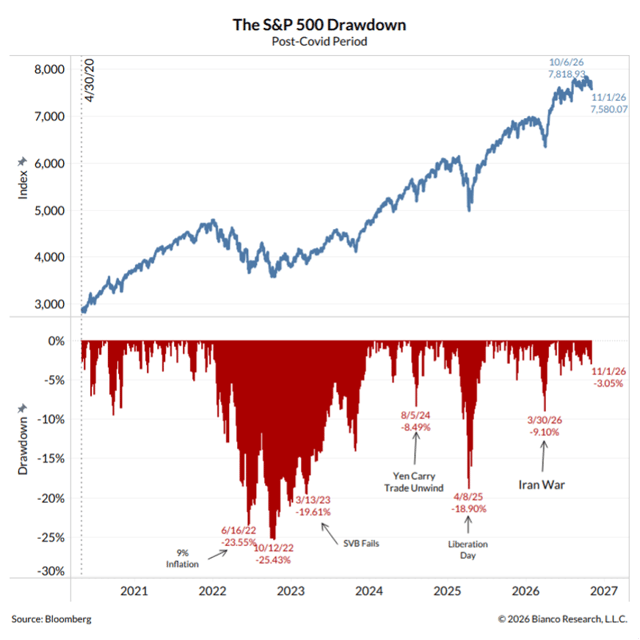
As of 11/1/2026 (Source: https://x.com/biancoresearch/status/2116887789790982346)
We remain constructive but disciplined looking ahead. History suggests volatility often rises around midterm elections, and with so much of the AI infrastructure buildout dependent on government policy, we think tradition will hold. Equity supply is also building. 2026 is on pace for record issuance in dollar terms, and a potential mega-IPO from Anthropic is expected before year-end. Large new listings test investor appetite for AI exposure, and their outcome bears directly on the AI financing story we have been watching. We will keep favoring hard assets, shareholder yield and special situations where we believe the market misprices deal dynamics, while maintaining short exposure to what we see as excesses in AI-related and over-leveraged businesses.
“2027 is going to be a very challenging year for the market.”
“Right now feels exactly like 1999, for me it’s just so clear that we’re on this path that could be great short term but may not be so great long term… I forget that so many people haven’t lived this… I’m sure in ’27, at some point, I’ll be short the whole year. There just — there’s little value… Well, again, if you go back to 2000, you had all this issuance, all these IPOs in ’98 and ’99, and really 2000, 2001, 2002. Those were the easiest years to be short because you kept having these unlocks that just kept adding supply to the market.”—Paul Tudor Jones, Squawk Pod, October 13, 20264