The Leatherback Long/Short Alternative Yield ETF (LBAY) (the “Fund”) advanced by 7.85% in March, compared to 4.38% for the S&P 500 Index1. LBAY paid our fourth consecutive monthly distribution of $0.06 per share, which equates to a 3.04% SEC yield3 versus the S&P 500 Index estimated 12-month dividend yield of approximately 1.46%, and the 10-Year US Treasury yield of approximately 1.65%. Cumulative inception to date, NAV for the Fund has produced a 15.42% cumulative total return, compared to 10.69% for the S&P 500 Index2.
March was a good time to be a short seller. It was also a good time to have minimal exposure to the technology sector and to be well-positioned for a rise in rates. These factors combined to help drive a very strong month for overall LBAY portfolio performance, and should bode well for the remainder of the year.
Starting in January, which though it may feel as though it were several years ago is still only a few weeks in the past, we witnessed weeks of market volatility and a narrative around short-selling dominating the headlines, with short-sellers being cast as the villain. There were suspected short-squeezes taking place in a handful of then out-of-favor but now high-profile names, with GameStop becoming the poster child for the “meme stock” category. Trading halts were issued, lawsuits filed, Congressional testimony ensued, and all the while short sellers mainly retreated to the sidelines. Fast forward to today, and the financial news cycle has largely shifted away from this phenomenon. But based on the data below, Median S&P 500 stock short interest remains very low.4
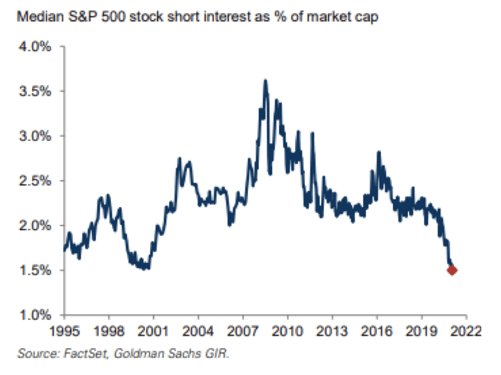
As you can see, short interest has not just declined, it has dropped to levels we have not seen since before the dot-com bubble burst. And with so many short sellers having exited the arena, even if just for the time being, it is a very good time to be a long/short manager.
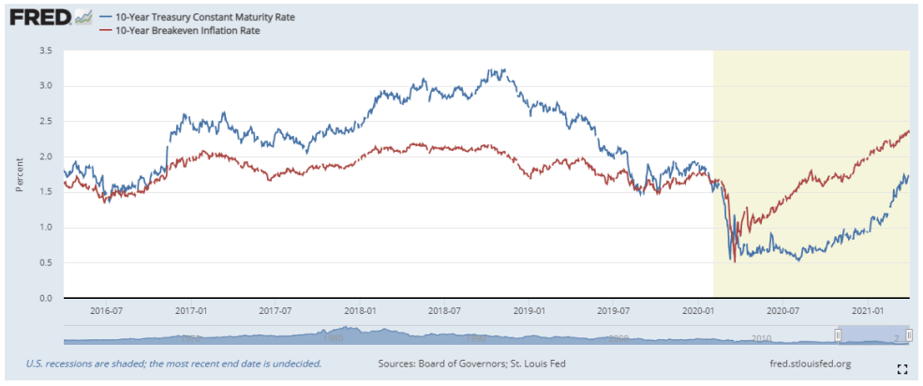
Additionally, during February and into March, we saw headlines about consumers starting to step back out in force while at the same time interest rates began to rise (albeit while still at historically low levels). The Federal Reserve and bond market participants are at a temporary impasse over inflation expectations and the telegraphed tapering of open market operations, which is keeping Treasury yields in a range as we write this piece. Equity markets have responded to these trends in-kind with sector rotation and a recalibration of valuations.
The Fund has been well positioned with what we think is a bias toward protection against interest rate sensitivity, with a focus on the rerate of implied market inflation expectations compared to realized inflation, and interest rates backing up given the velocity of the reopening of the U.S. economy. Market participant expectations are evolving around this thesis as reflected in implied breakeven inflation rates and nominal interest rates, which have been ticking up, as seen in the below chart.5
Some of our factor exposures in LBAY on the long side, have been to food prices, agriculture and commodity prices, energy prices, materials, and financials. All of which have benefited from inflation perceptions changing and the resultant interest rate moves. Conversely, several of our factor exposures in LBAY on the short side, have been focused on companies that rallied as the result of the work/live/stay-at-home impact of COVID-19, as well as historically-high price multiples, namely in technology shares which have seen a significant run-up since a year ago.
The first quarter of 2021 has been an eventful one for capital markets and notable for its shift in market leadership; or lack of technology leadership. The technology sector underperformed the overall S&P 500 for the first time since Q4 of 2018. Not since the year 2013, has technology underperformed the overall market on an annual basis. We suspect that interest rates and inflation expectations will determine whether that streak ends.
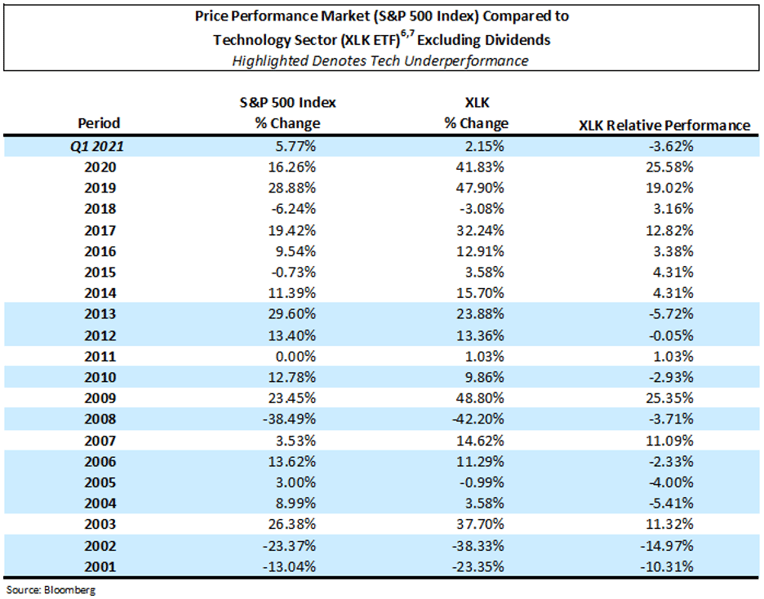
The sector underperformance in Q1 of 2021 has occurred as technology has become the largest weight (28%) in the S&P 500; and this no longer includes three of the “FANG” stocks (FB, NFLX, GOOGL) which collectively equate to $2.7 trillion of market value that were removed from the sector. Notably, our Fund has no long exposure to the technology sector and, in fact, maintains a net short position. In our view, too much risk capital has been concentrated in too few names, leaving a lot of value to be
identified and captured elsewhere.
While our long positions still do not currently include a large weighting to growth and technology, we are not closing the door on the tech sector. In fact, we think the market may be setting up for interesting company-specific opportunities to add this factor exposure. We have long been skeptical when it comes to the companies that have no or low revenues and that have not yet fully sorted their path to profitability. Recently, that has led us to avoid much of what one finds in the NASDAQ; a line of thinking that has been a net positive for our overall portfolio performance since LBAY went live in late 2020 and something that has put us at odds with much of the rest of the market, until recently at least.
With the trajectory of inflation expectations, the Treasury rate tug of war, equity valuation rerates, and sector rotation, a looming question for the market is this: Where do interest rates go from here, and does it matter?
We think there are opportunities to explore no matter what the answer is, and we look forward to continuing our dialogue in the weeks and months ahead.
